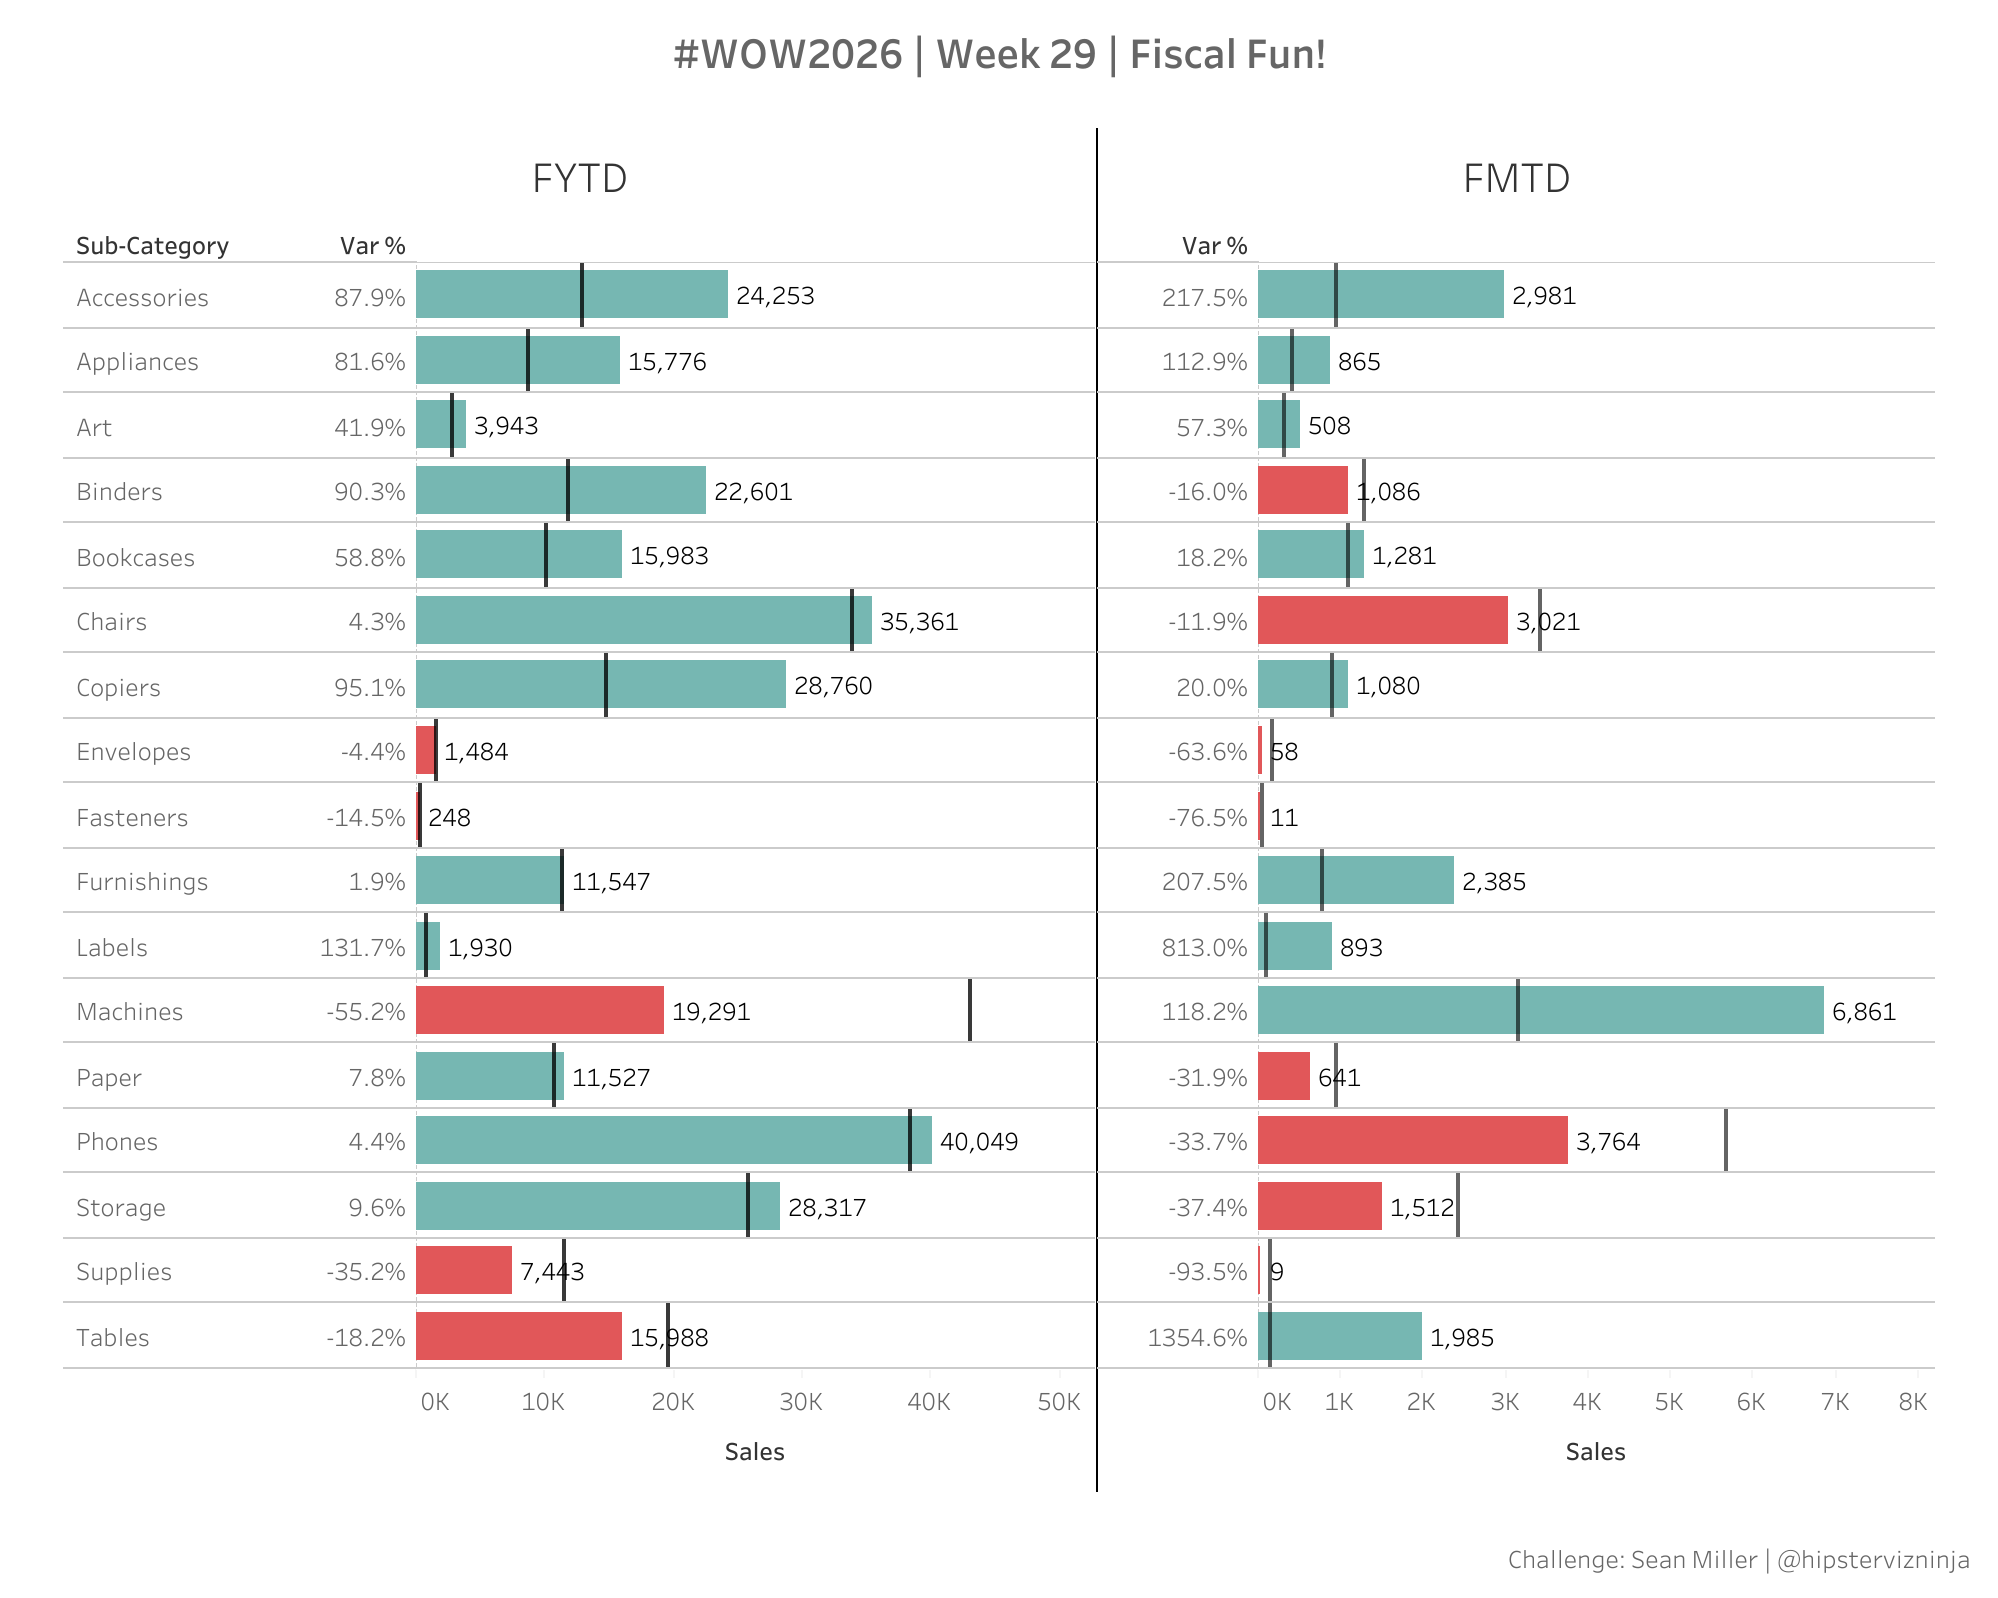
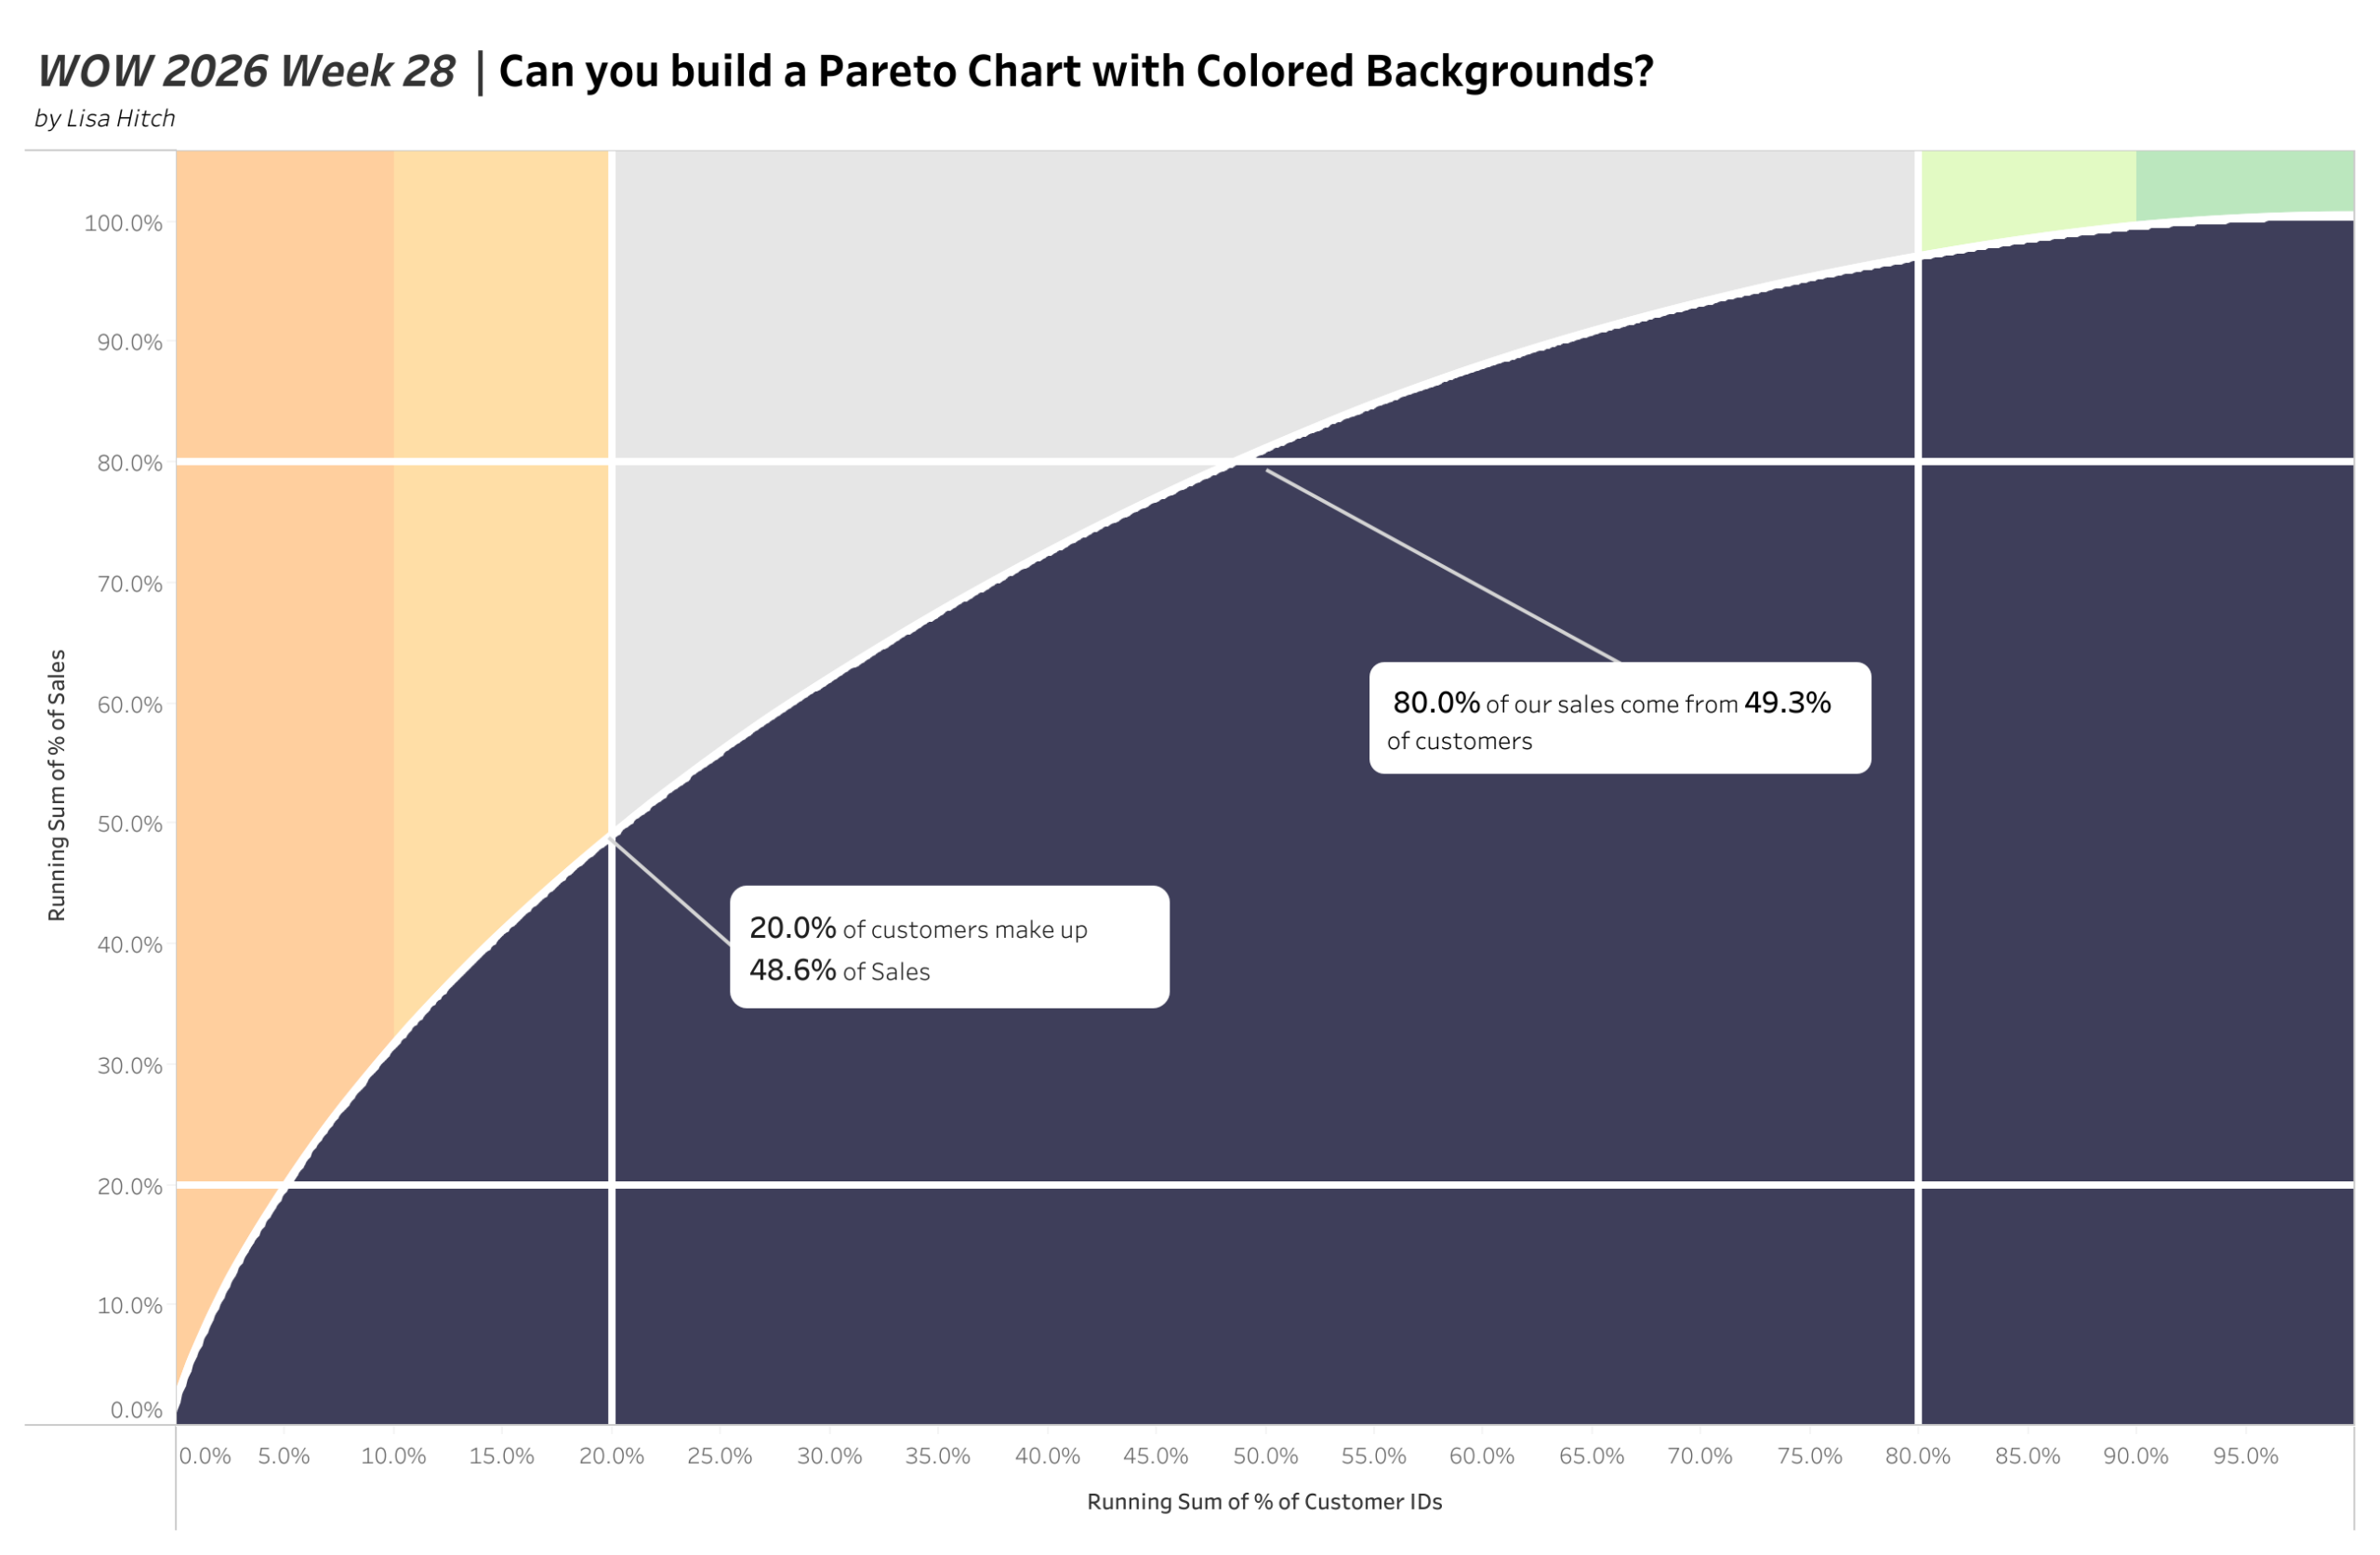
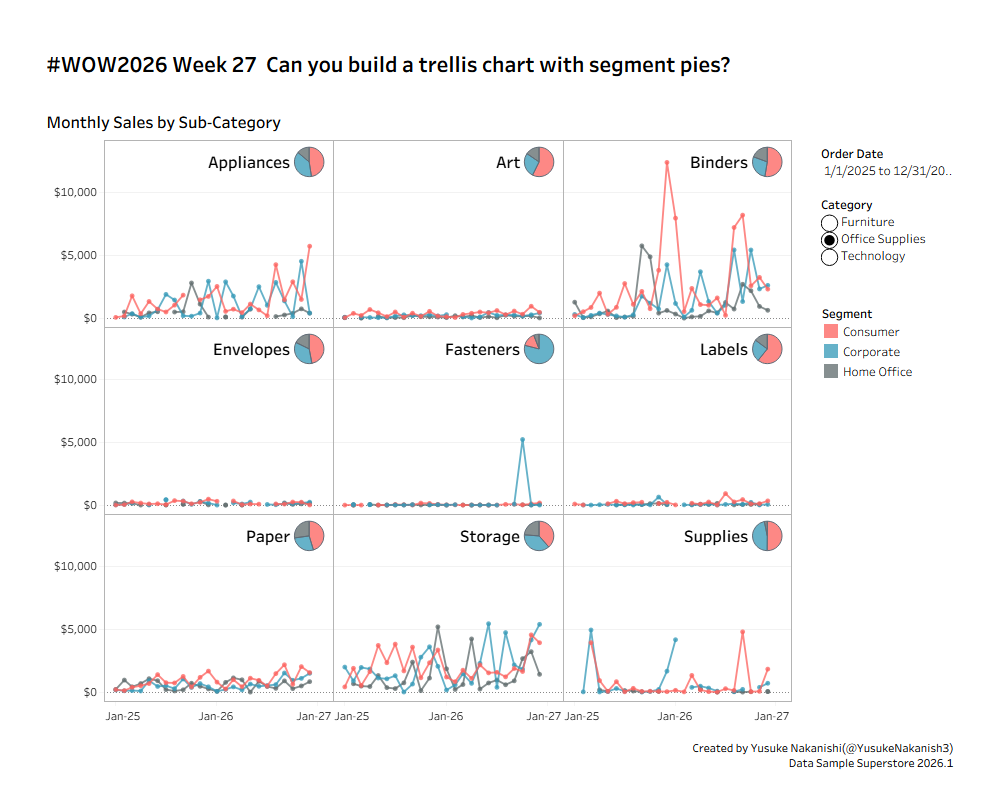
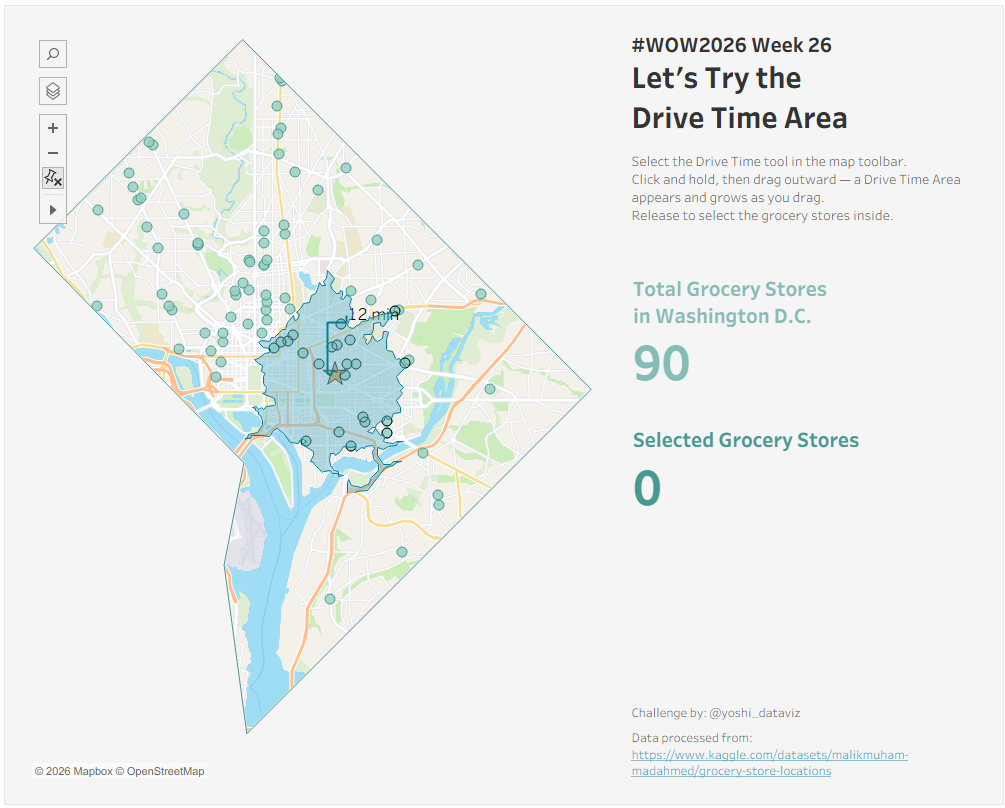
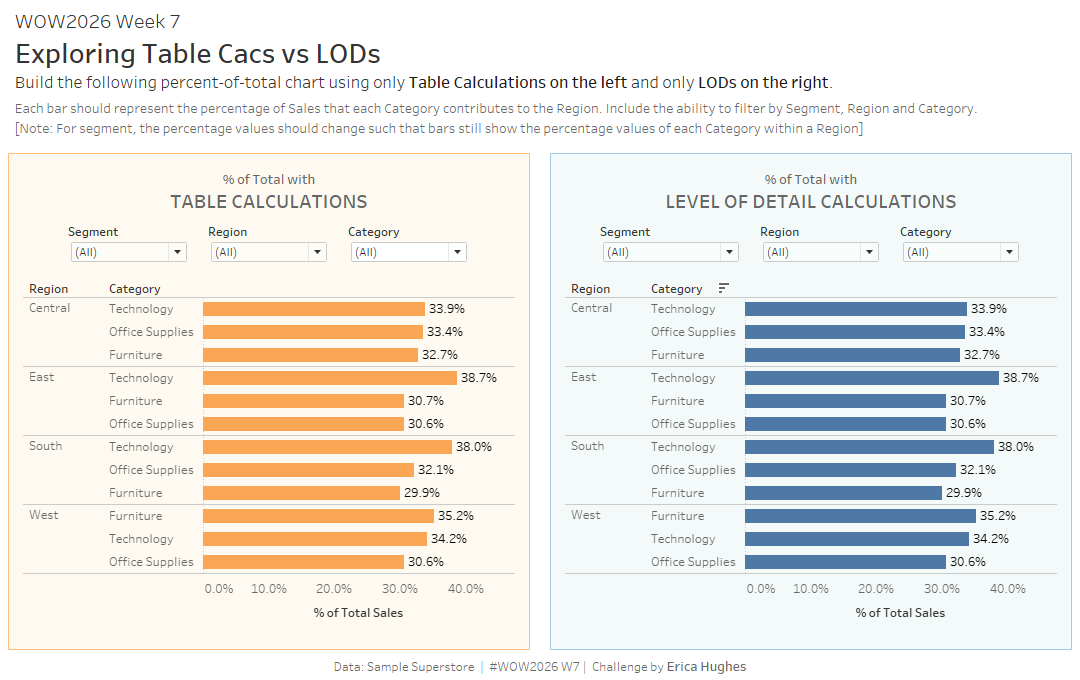
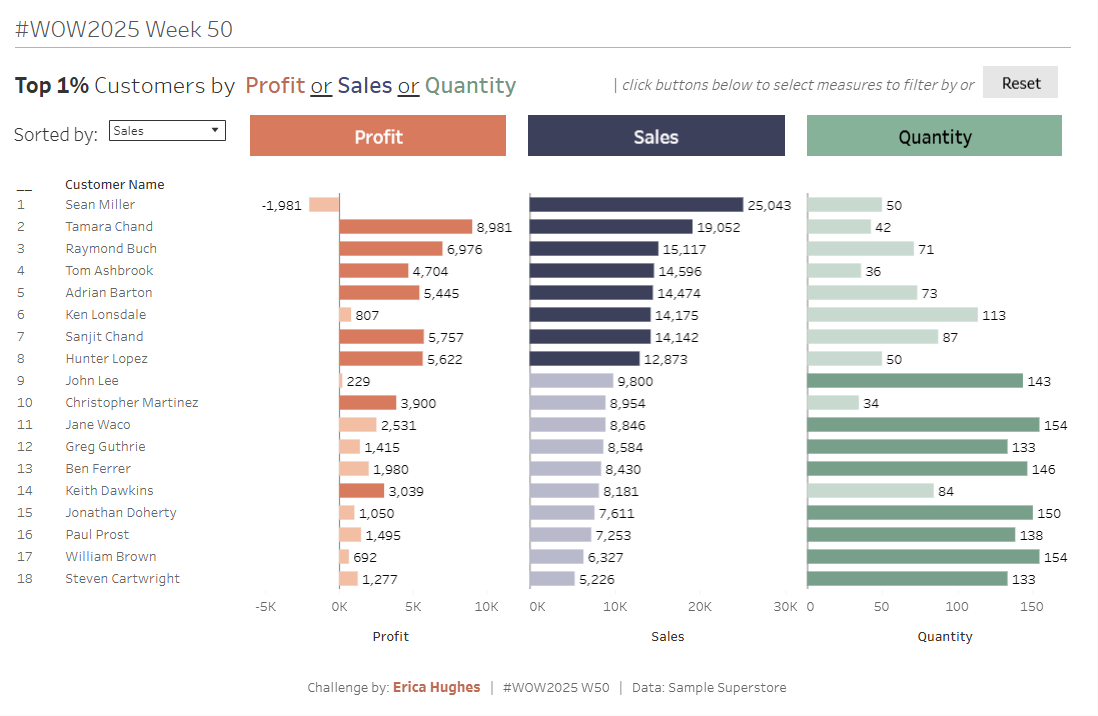
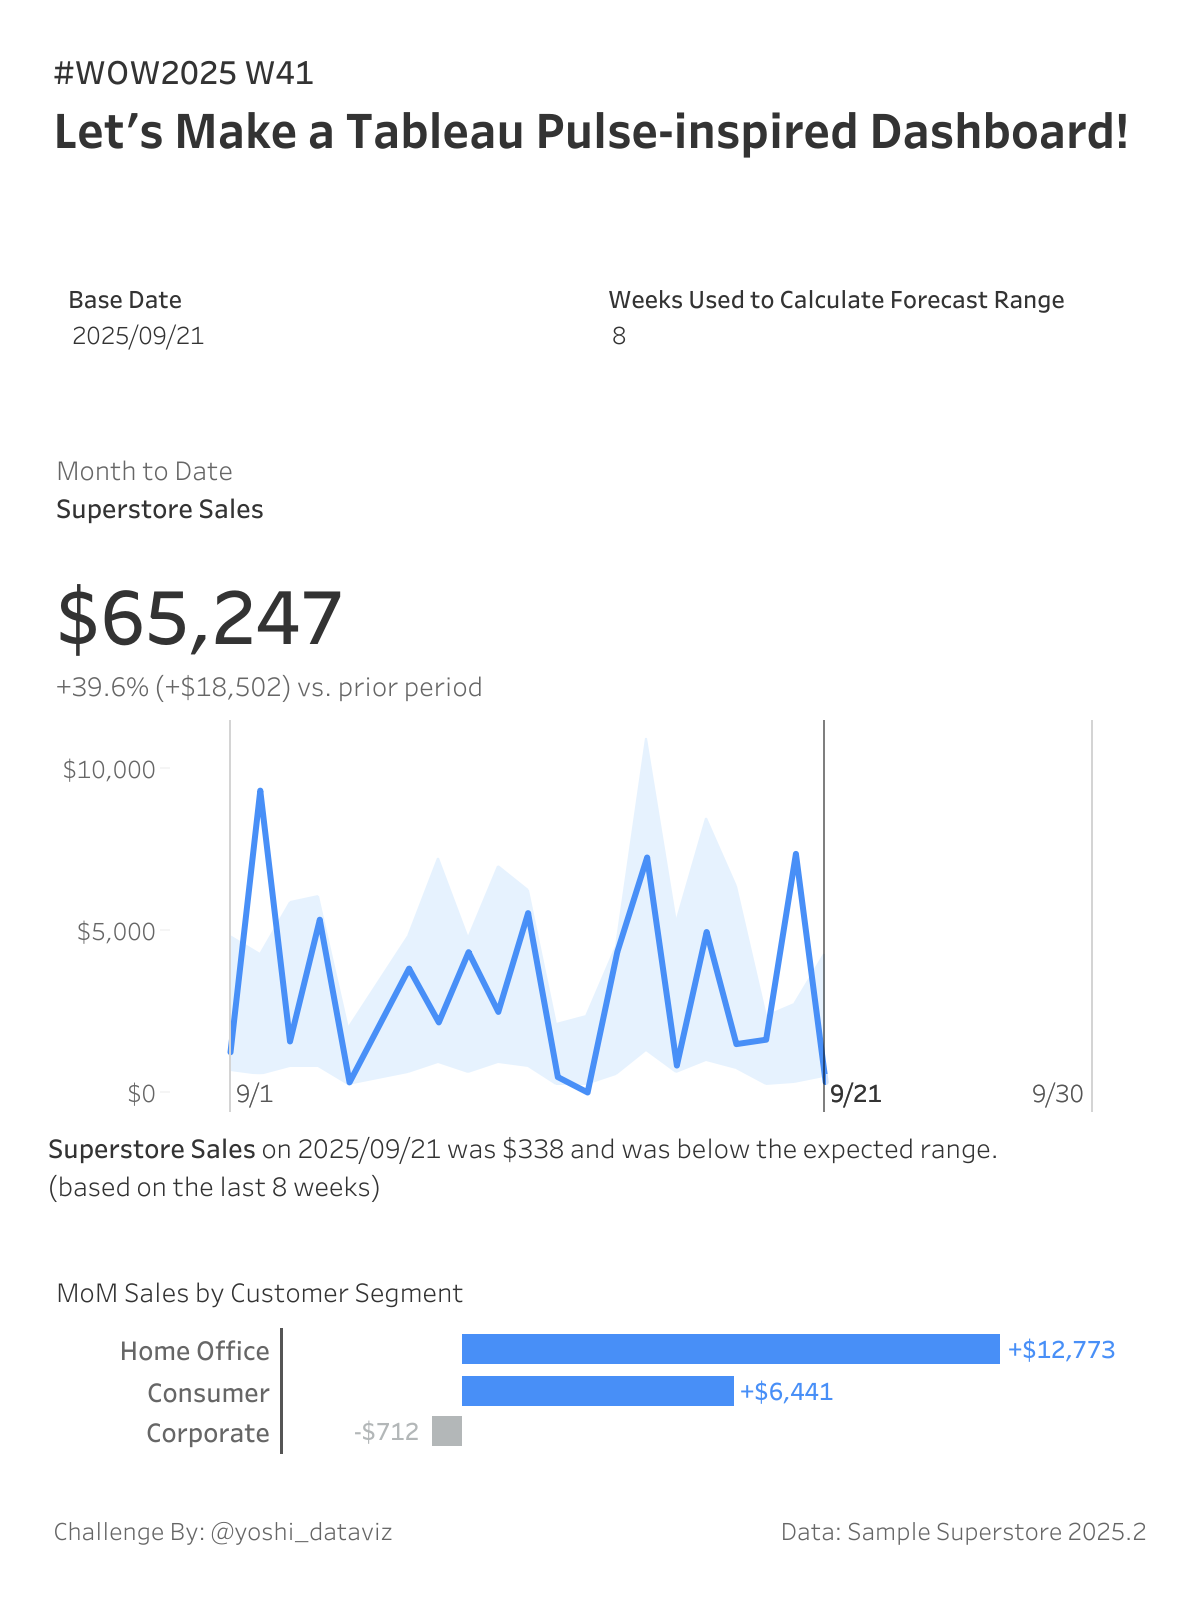
Latest Challenges in Tableau fiscal date #WOW2026 | Week 29 | Fiscal Fun paretoTable Calcs 2026 | Week 28 | Can you build a Pareto Chart with Colored Backgrounds? table calculation #WOW2026 | Week 27 | Can you build a trellis chart with segment pies? maps #WOW2026 | Week 26 | Let’s Try the Drive Time Area parameter actions 2026 Week 25: Can you show difference from selected Sales? DistanceLevel of Detailmap layers #WOW2026 | Week 24 | Can you measure and visualize travel distance? table calculations #WOW2026 | Week 23 | Can you create a double-sided multi-row Stem-and-Leaf Plot? Gantt Chart #WOW2026 | 23 | Fun with Gantt Charts Spatial #WOW2026 W21: Can you map out the D3 athletic conferences? formatting #WOW2026 | Week 20 | Expanding Rows lods #WOW2026 | Week 19 | Can you visualise Customer Spend Insights? date calculation #WOW2026 | Week 18 | Let’s Visualize TC25! (#TC26 Live Edition) radar chartviz extensions #WOW2026 | Week 17 | Can you build a radar chart using viz extensions? map layers #WOW2026 | Week 16 | Can you build a radar chart with map layers? marimekko #WOW2026 | 15 | Mekko charts and offset labels calculations #WOW2026 | Week 14 | Can you calculate the correct metric? filters #WOW2026 | Week 13 | Let’s Viz Tsukurima Show! viz extensions #WOW2026 | Week 12 | Create a Gauge Chart with Tableau Extensions containersDashboard #WOW2026 | Week 11 | Can you use layout containers? #WOW2026 | Week 10 | Baseline YoY Revenue table calculations #WOW2026 | Week 9 | Can you build a parallel coordinates chart? dzv #WOW2026 week 8: DZV and Filter Actions LOD expressionstable calculations #WOW2026 | Week 7 | Exploring Table Calcs vs LODs filters #WOW2026 | Week 6 | Can you account for nulls in your averages? date calculation #WOW2026 | Week 5 | KPI Trend Monitor with Period Comparison Datesorder of operationstable calculations #WOW2026 | Week 4 | Can you create a dynamic moving average? viz extensions #WOW2026 | Week 3 | Can you create KPI cards with viz extensions? viz in tooltip #WOW2026 | Week 2 | Can you create a fake Viz in Tooltip? parameter #WOW2025 | Week 50 | Top 1% of Customers by Profit OR Sales OR Quantity lods #WOW2025 W49: Can you create breadcrumbs for filters? table calculations #WOW2025 | Week 48 | Advanced Bar Chart Race pages #WOW2025 | Week 47 | Can you make a bar chart race? Buffermap layers #WOW2025 | Week 46 | Can you create a dynamically zooming map? WOW2025 | 45 | Population Pyramids map layers #WOW2025 | Week 44 | Can you build a satellite chart to represent values exceeding 100%? table calculation #WOW2025 | Week 43 | Can you build a ranked heatmap tile? parameter actions #WOW2025 | Week 42 | Dynamic Dimension Coloring Modeling #WOW2025 | Week 41 | Let’s Make a Tableau Pulse-inspired Dashboard! lodsParameters #WOW2025 | Week 40 | Can you create this Zoom and Reset Scatter Plot? set actions #WOW2025 | Week 39 | Can you create a drill-down? Load More
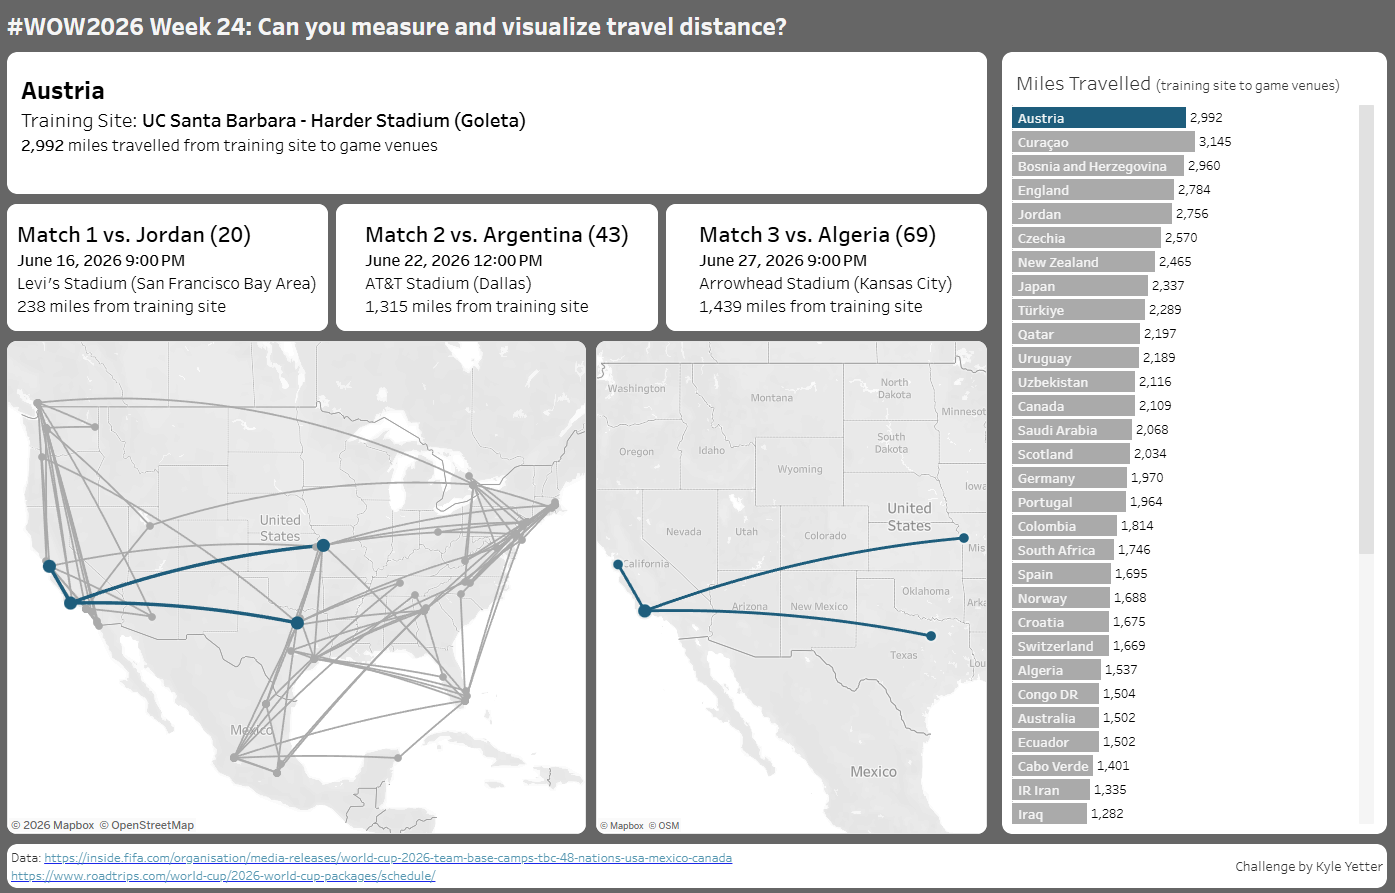
DistanceLevel of Detailmap layers #WOW2026 | Week 24 | Can you measure and visualize travel distance?
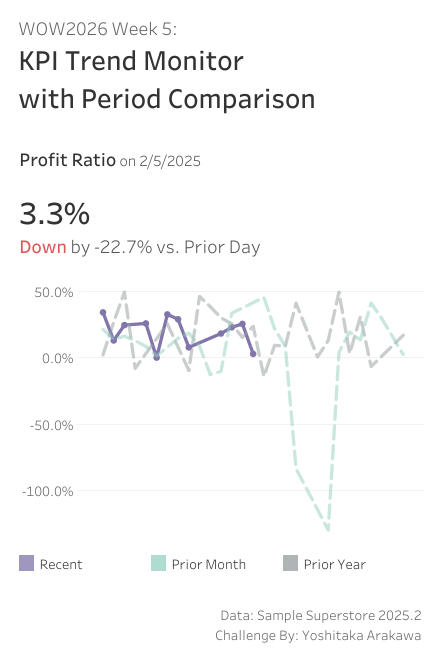
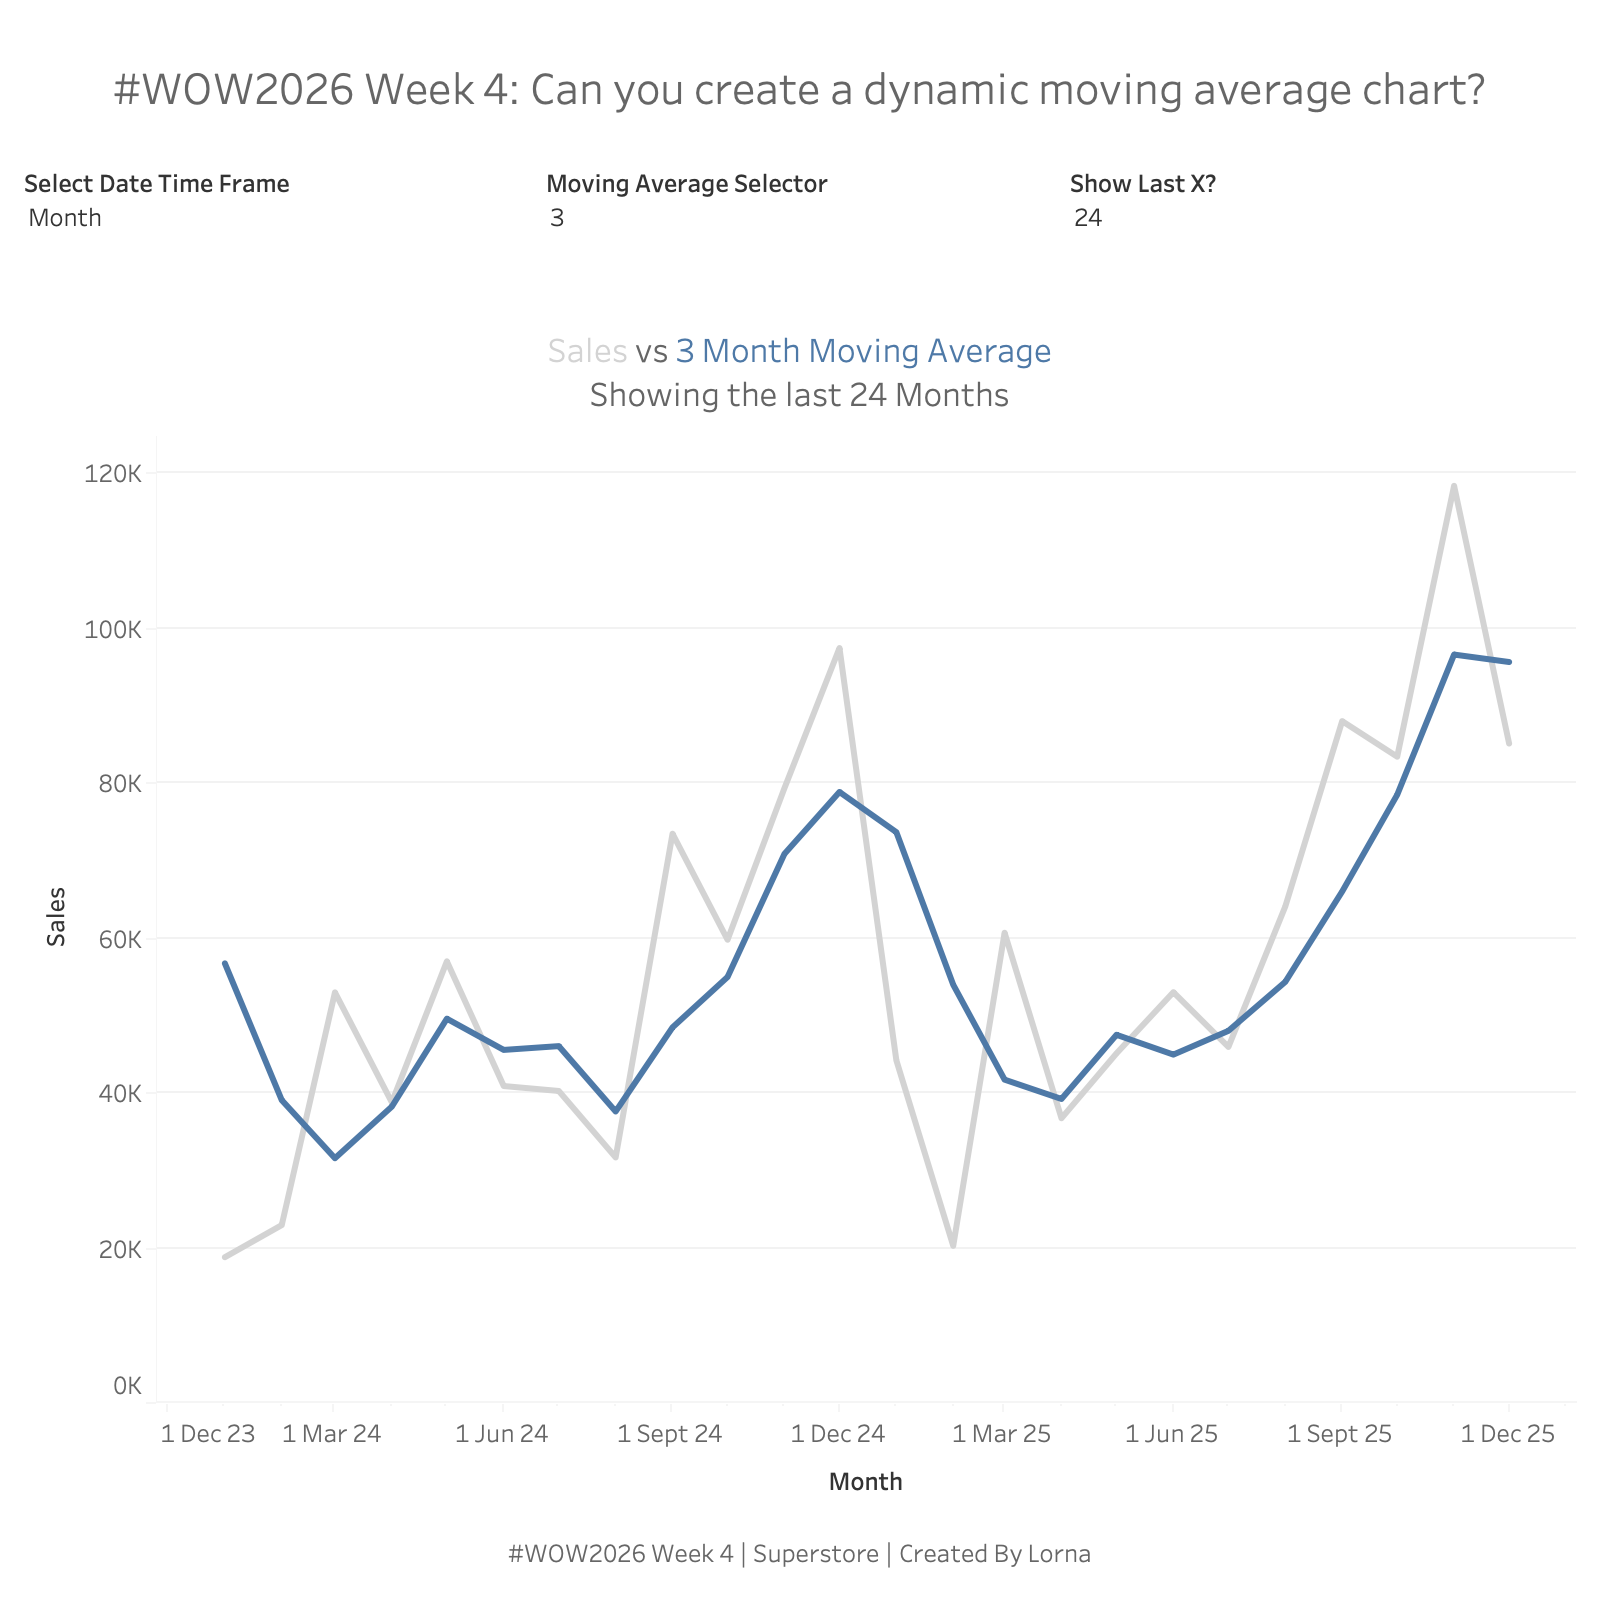
Datesorder of operationstable calculations #WOW2026 | Week 4 | Can you create a dynamic moving average?