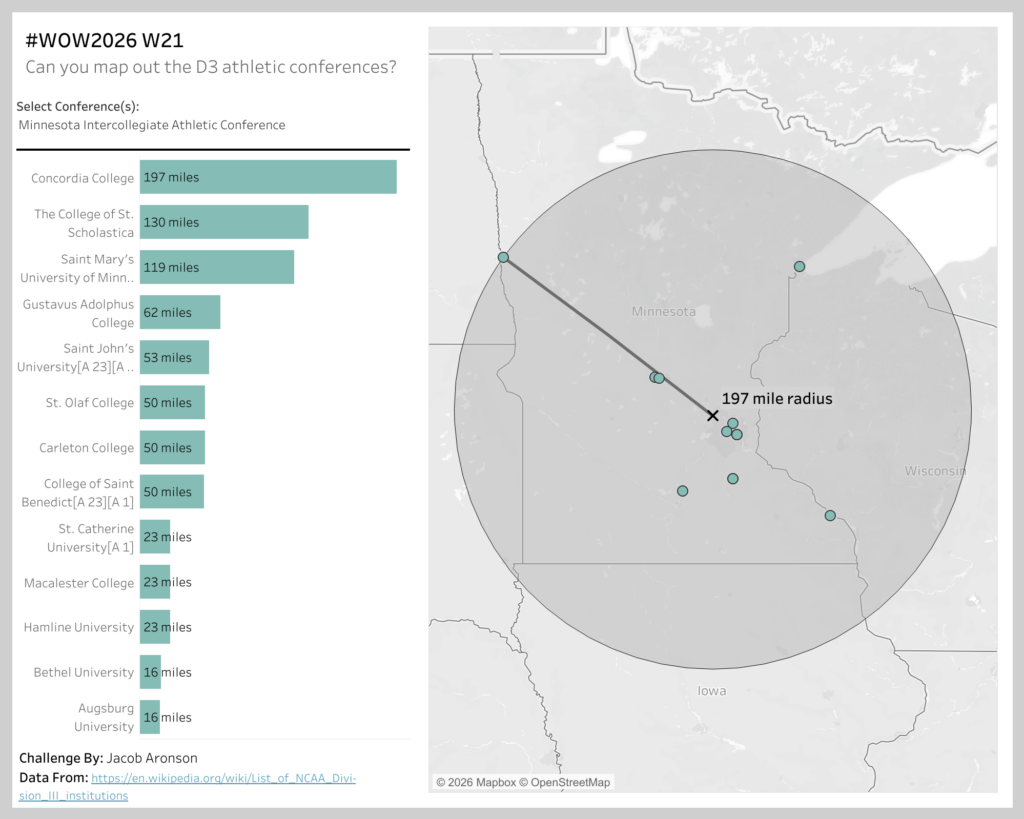
#WOW2026 W21: Can you map out the D3 athletic conferences?
Introduction This weeks challenge comes from a Data School Consultant – Jacob Aronson This week’s challenge puts the spotlight on some of America’s lesser known colleges and universities – those that compete at the D3 athletic level (including my Alma Mater, Carleton College).The 400 schools are organized into ~44 conferences so that teams that are […]
#WOW2026 W21: Can you map out the D3 athletic conferences? Read More »
Tableau, Workout Wednesday