
Introduction
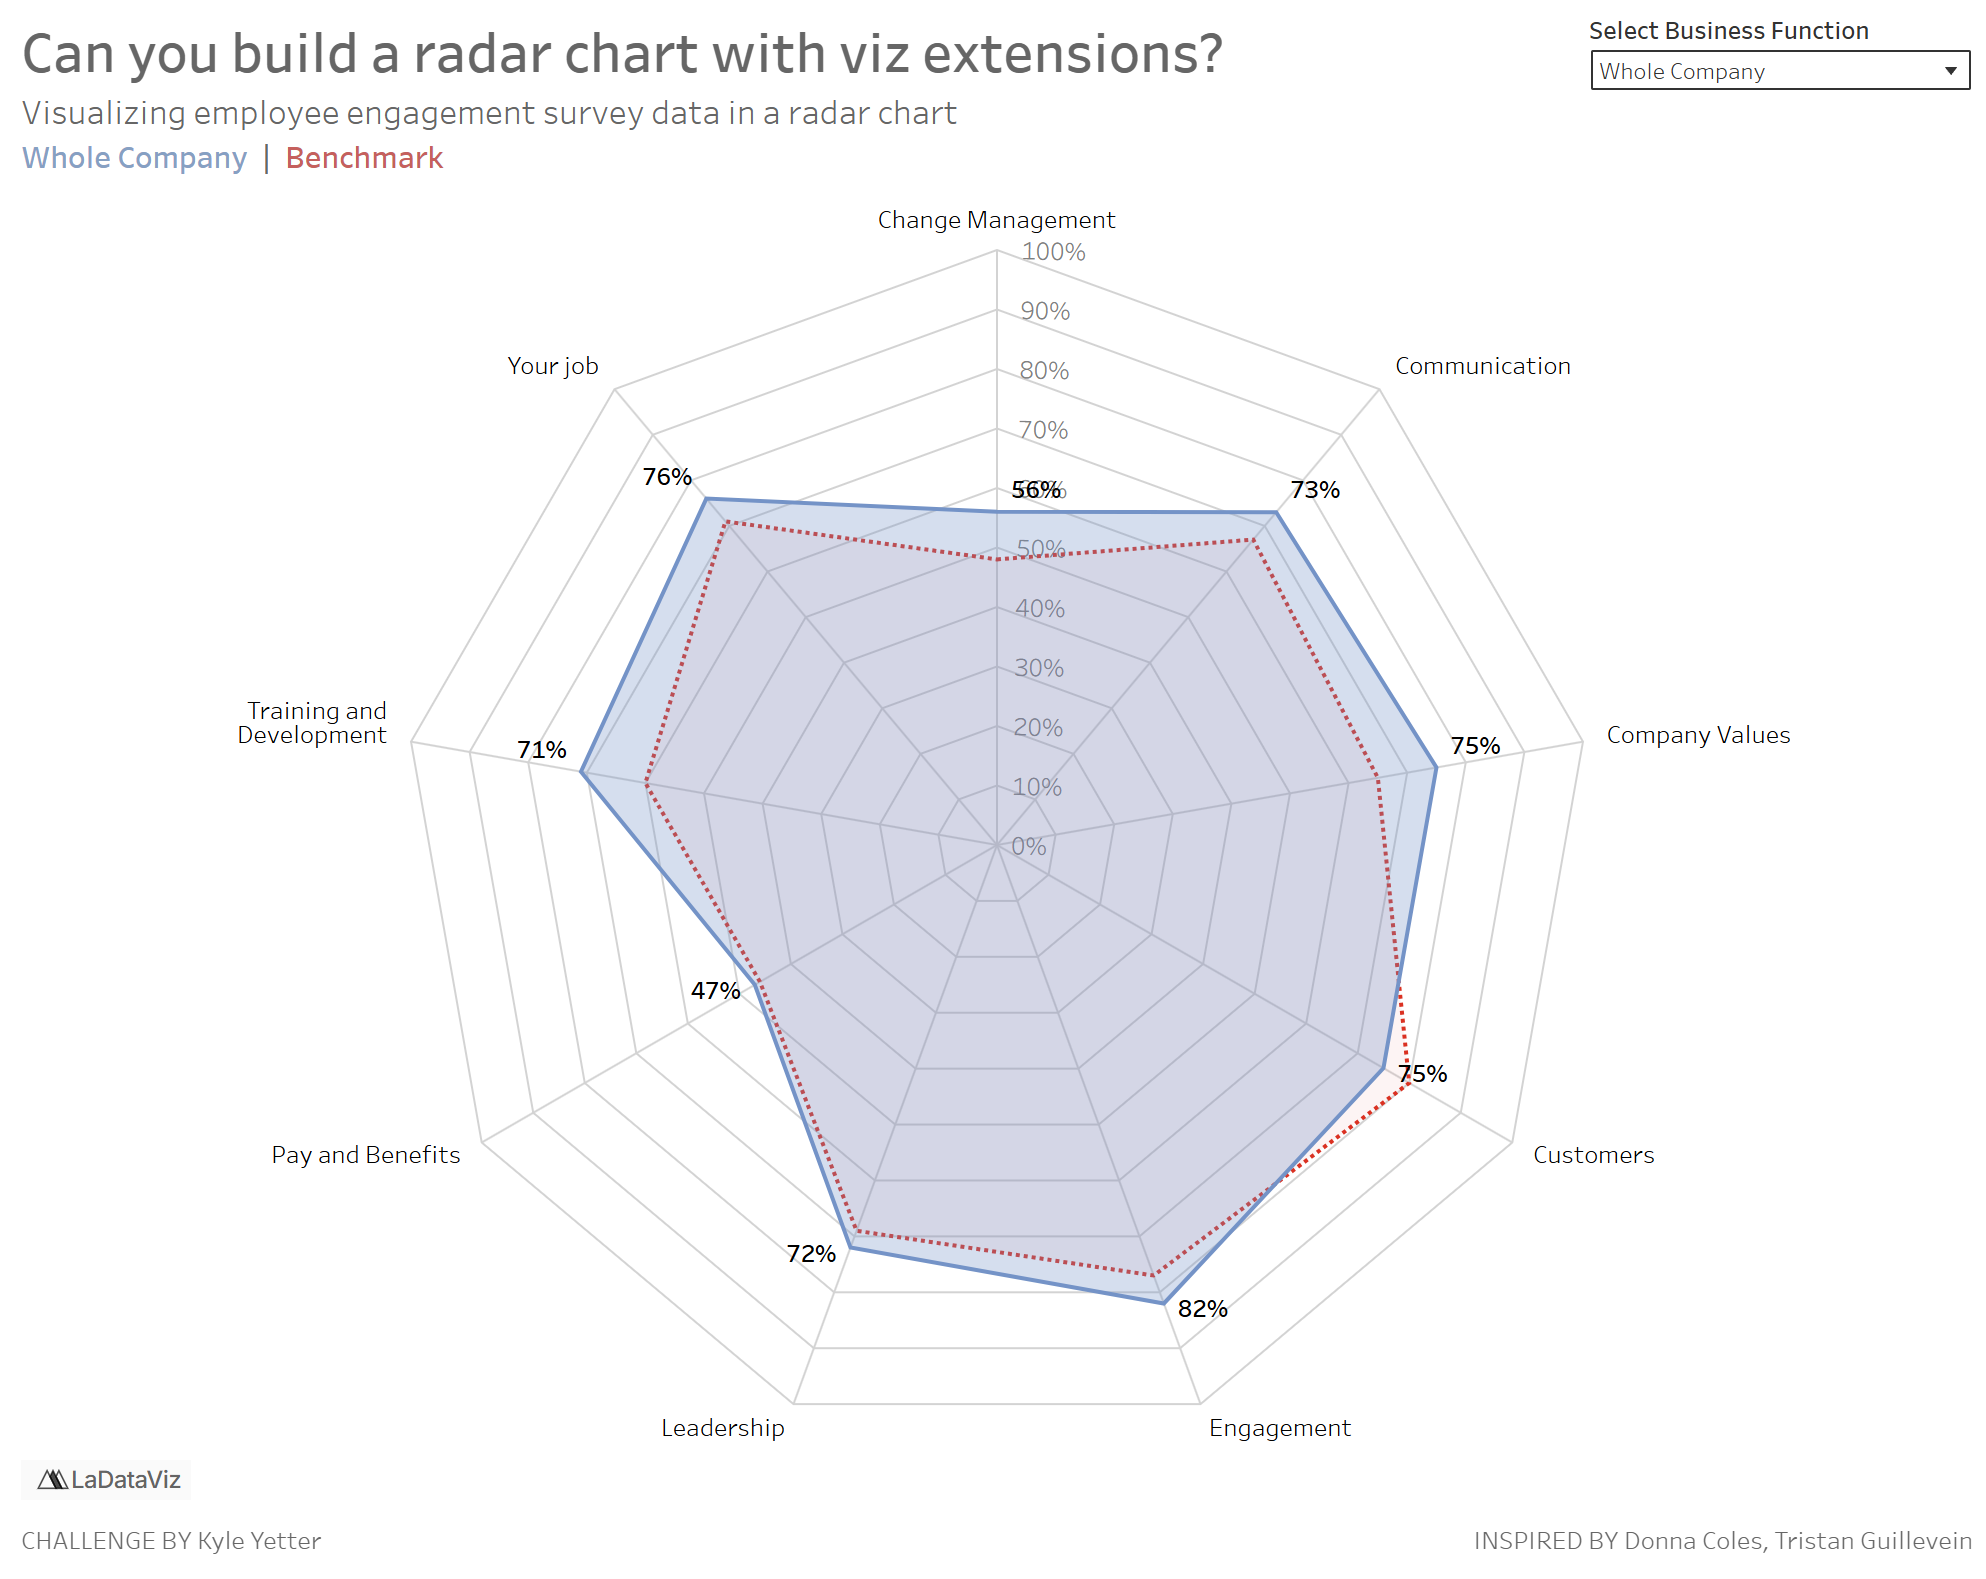
Since I jumped the gun on Community Month with Jack’s guest challenge last time around, I was exploring some of the other viz extensions from LaDataViz, when I came upon a radar chart. Since Donna’s challenge last week was a radar chart inspired by a community member technique, I thought it would be interesting to use the same data set to create a radar chart using a different community member’s technique, this time in the fashion of a viz extension.
So we’ll be looking at the same data we worked with last week, and as you build the radar chart, pay attention to what you can/can’t do with the viz extension that you could/couldn’t do with map layers. I think there are definitely scenarios where we’ll still want to utilize the map layer technique, but for many cases, the viz extension as it exists is a potentially quicker solution.
Enjoy!
Requirements
- Dashboard size: 1000 x 800
- Using a Radar viz extension (I used the one from LaDataViz, but noticed there is also one available from Infotopics as well), create a radar chart showing the value of the selected Area compared to the Benchmark.
- Note: You’ll need to work on filtering to a selected Area in addition to the Benchmark, but the Benchmark shouldn’t be in the list of Areas you choose from
- As I always encourage with viz extensions, play around with things, so what’s there, what can be done.
- As an example, at first I thought it would only set the outer boundary based on the values for that particular area; however, I found a couple settings that helped me make it a consistent 100% (you should also find that setting for yours)
Dataset
Available from here.
Attribute
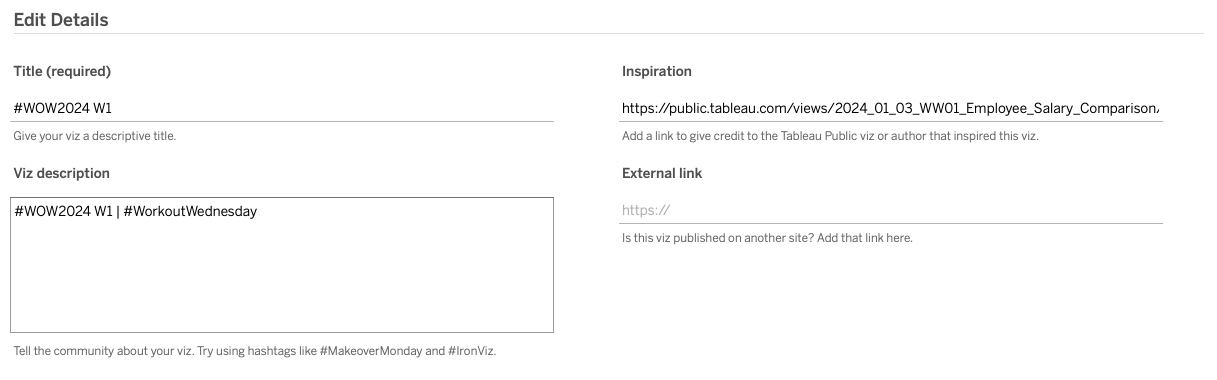
When you publish your solution on Tableau Public make sure to take the time and include a link to the original inspiration. Also include the hashtag #WOW2026 in your description to make it searchable!
Share
After you finish your workout, share on Twitter and/or LinkedIn using the hashtag #WOW2026 #Tableau and tag @WorkoutWednsday
Solution
Interactive
