Introduction
When browsing around for inspiration for this week’s challenge, I came across this stem & leaf Power BI WOW challenge by Meagan Longoria, which in turn was inspired by a Tableau #WOW challenge set by Yusuke in 2024.
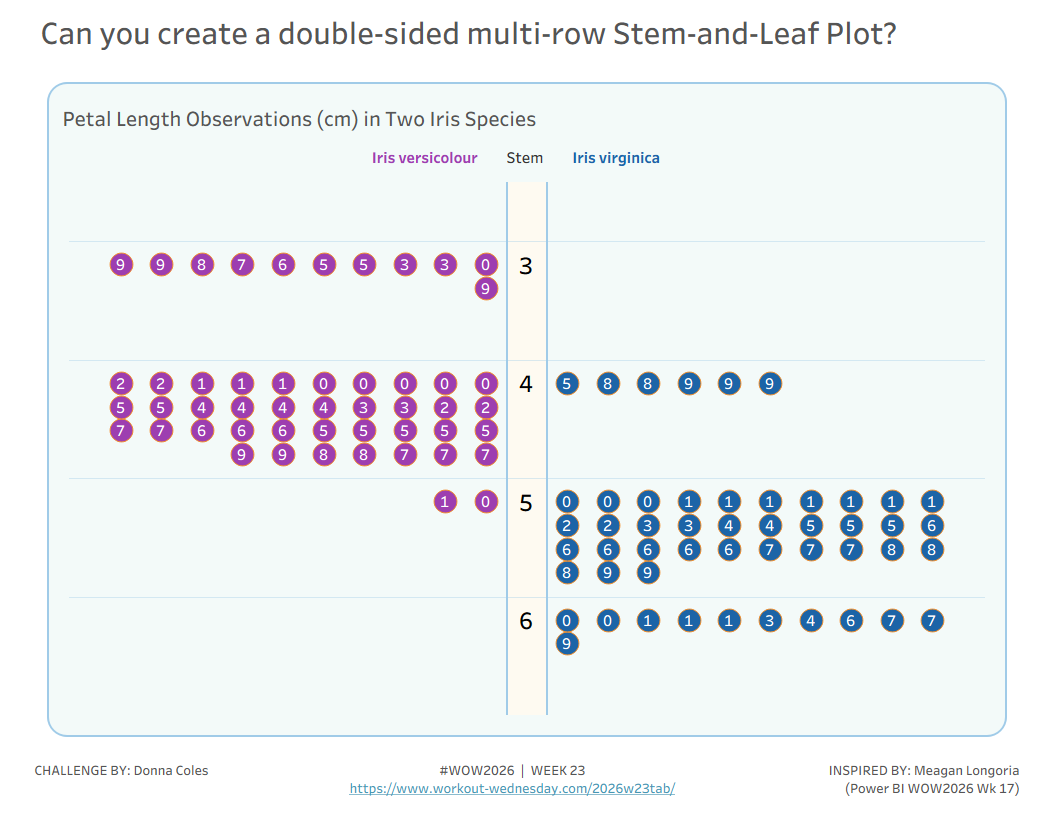
So I thought it would be fun to go ‘full circle’ and see if I could recreate Meagan’s challenge in Tableau, which builds on Yusuke’s challenge, as in this instance, it requires the ‘leaves’ to be spread across multiple rows.
The data set provided contains data about the petal sizes for 2 sets of Iris species. A Row ID field provides a unique identifier for each row.
Requirements
- Dashboard 1000 x 800
- Define the Stem and Leaf variables
- Stem: The integer number to the left of the decimal in the petal length (cm) column
- Leaf: The value to the right of the decimal in the petal length (cm) column
- Create a stem-and-leaf plot that shows the integer portion of the number in the stem and the decimal portion of the number in the leaf.
- Plot the leaf values for the Iris versicolor on left side and the values for the Iris virginica on the right side.
- Adjust the layout of the leaf circles so that they are displayed across rows of 10
- The leaves in each row per stem should be ordered based on the Leaf value
- Display the stem value centrally in a banded column
- Match formatting and tooltips (colours as you wish)
- Ideally build in a single sheet if you can (note in my case, the ‘field headings’ are text fields on the dashboard)
Dataset
Curated data set available from here.
Attribute
When you publish your solution on Tableau Public make sure to take the time and include a link to the original inspiration. Also include the hashtag #WOW2026 in your description to make it searchable!

Share
After you finish your workout, share on Twitter and/or LinkedIn using the hashtag #WOW2026 #Tableau and tag @WorkoutWednsday
Solution
Interactive
