Author name: Yoshi Arakawa

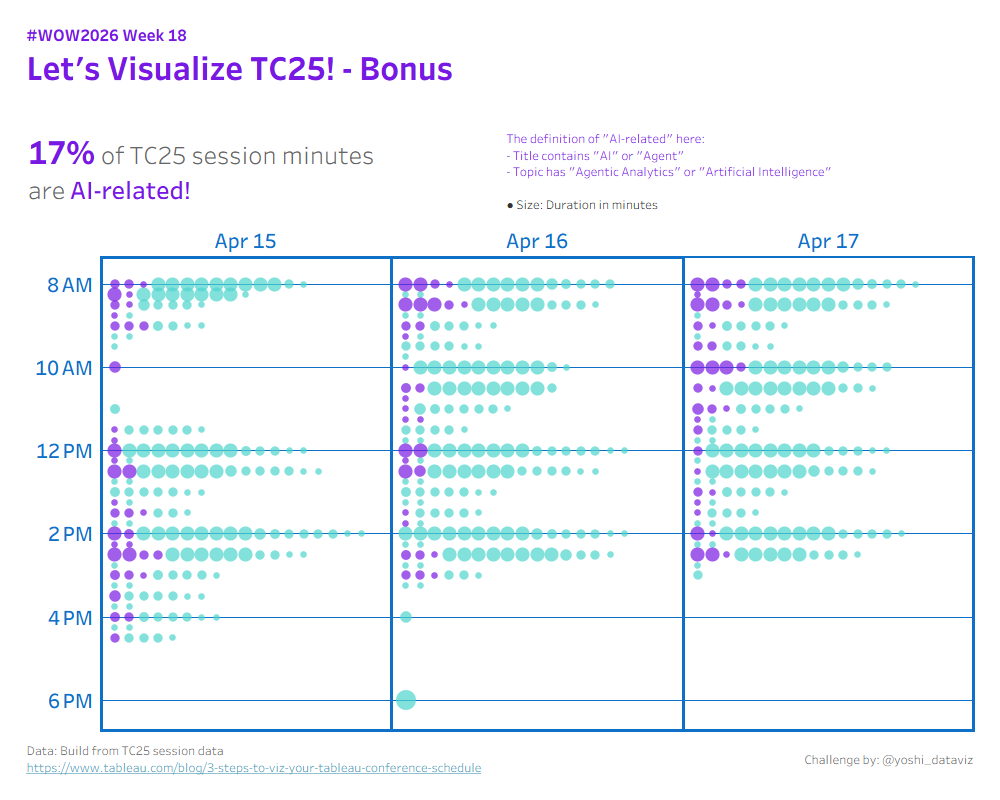
#WOW2026 | Week 18 | Let’s Visualize TC25! (#TC26 Live Edition)

Introduction This challenge was released at the TC26 Workout Wednesday session. Whether you’re here in the room or finding it later, I hope you’ll have fun! In this challenge, we’ll visualize the sessions of Tableau Conference itself. Three difficulty tiers are available, so pick the one that matches your confidence and give it a try. […]

#WOW2026 | Week 18 | Let’s Visualize TC25! (#TC26 Live Edition) Read More »

Tableau, Workout Wednesday
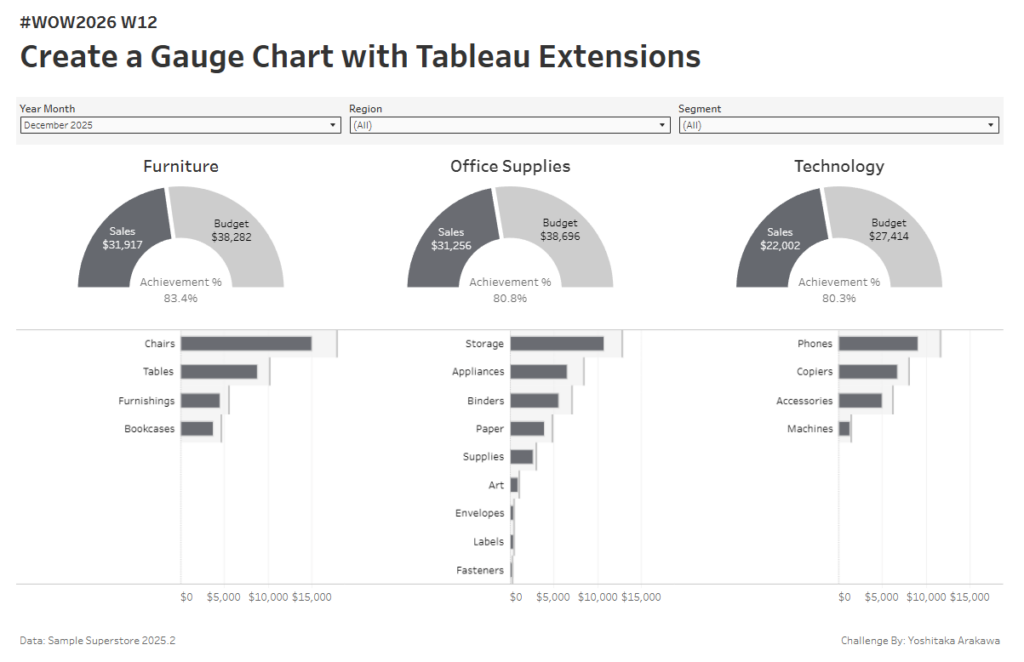
#WOW2026 | Week 12 | Create a Gauge Chart with Tableau Extensions

Introduction I was recently looking into the Radial Viz Extension after Sunburst support was added in Tableau 2025.3, and realized it can also create gauge charts with ease. Turns out this has actually been possible since the Radial Extension first launched in 2024.2! Building gauge charts in Tableau used to require map layers and dedicated

#WOW2026 | Week 12 | Create a Gauge Chart with Tableau Extensions Read More »

Tableau, Workout Wednesday
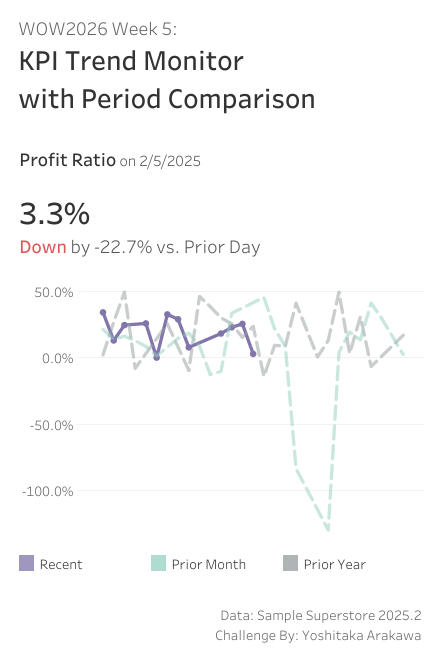
#WOW2026 | Week 5 | KPI Trend Monitor with Period Comparison

Introduction Thanks to tools like Tableau MCP, AI can now handle deep-dive data analysis for us. Ask it “why is this metric dropping?” and you’ll get a pretty solid answer. But before that step — noticing that something looks off in the first place — that’s still on us, looking at a dashboard. This week,

#WOW2026 | Week 5 | KPI Trend Monitor with Period Comparison Read More »

Tableau, Workout Wednesday