
Introduction
Welcome to week 15 and week 3 of Community month! I’m so thrilled to be partnering with Tableau Visionary HOF’er, Linsday Betzendahl! 6 months ago or so, while chatting, she mentioned she was messing around with stacked bars originally for the offset labels but determined that the Mekko concept was actually where she had to start to solve this problem. I told her that it would make a great challenge for a future WOW challenge.
You can check out her original inspiration here. This bar chart and labels were originally two sheets but Linsday was determined to get it all in one!
So here we are. We’re using some open data from Our World in Data. We’ve got some hints and resources to help you along the way.
Requirements
- For the data
- Pivot the data to Disaster Type & Decadal Deaths
- Group Mass Movements, wet & dry into Mass Movements
- Group Floods and Glacial Lake outbursts in Floods
- Label Extreme Temperatures into Extreme Temps
- Be sure to add the recommended data attribution
- EM-DAT, CRED / UCLouvain (2025) – with major processing by Our World in Data
- For the Mekko tab
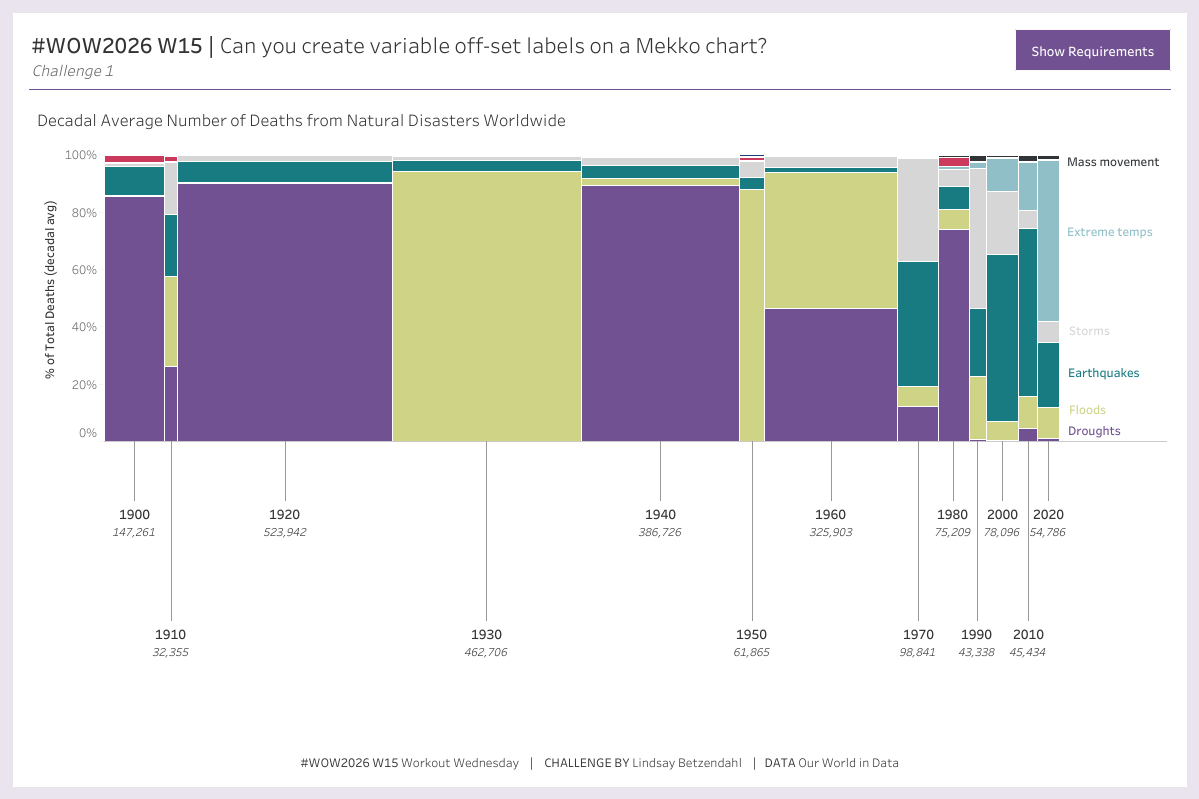
- Create the Mekko chart where each column is the percent of total deaths for a decade. Disaster Type on color also shows the percent of total deaths for each disaster and decade
- Create labels with the decade year and the average number of deaths that vary in length. Labels should connect to the Mekko via a thin line beneath and should be centered
- Show Disaster Type label for the last Mekko column only
- 1 sheet
- HINT: the size mark and the alignment of the size mark are the key to a Mekko chart
- For the Stacked Bar tab
- Create a horizontal 100% stacked bar chart where each column is the percent of total deaths for a decade.
- HINT: This may or may not be a traditional stacked bar chart
- Disaster Type on color
- Decade year on rows and limit to the last 3 available decades
- BONUS: Add a parameter to select the “anchor” decade. 3-decade lookback based on selected decade
- Create labels that show disaster type and percent of total. Labels should connect to and be centered on each disaster segment
- Only show labels and values where % of Total is greater than 4%
- Create a horizontal 100% stacked bar chart where each column is the percent of total deaths for a decade.
Helpful Resources
Dataset
Available from here.
Attribute
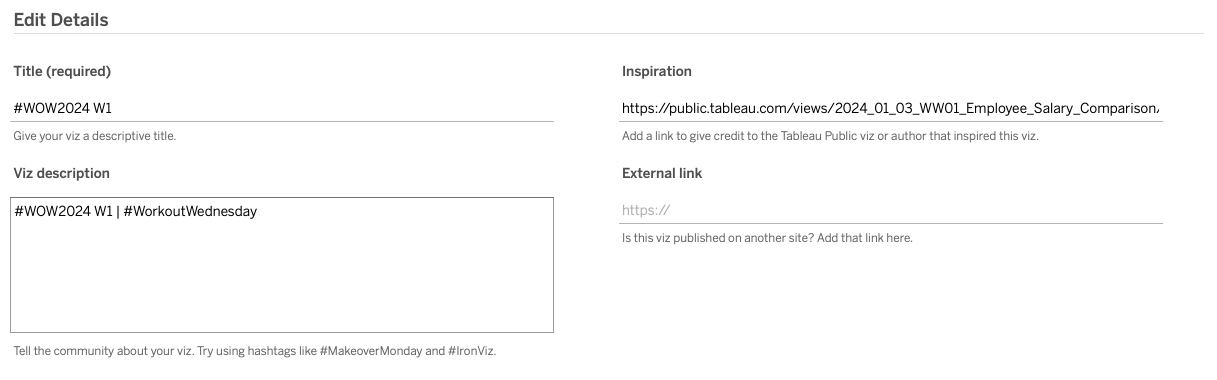
When you publish your solution on Tableau Public make sure to take the time and include a link to the original inspiration. Include the hashtag #WOW2026 in your description to make it searchable!
Share
After you finish your workout, share on Twitter and/or LinkedIn using the hashtag #WOW2026 #Tableau and tag @WorkoutWednsday, Lindsay, and Kevin
Solution
Interactive
