This weeks challenge comes from a Data School Consultant – Jacob Aronson
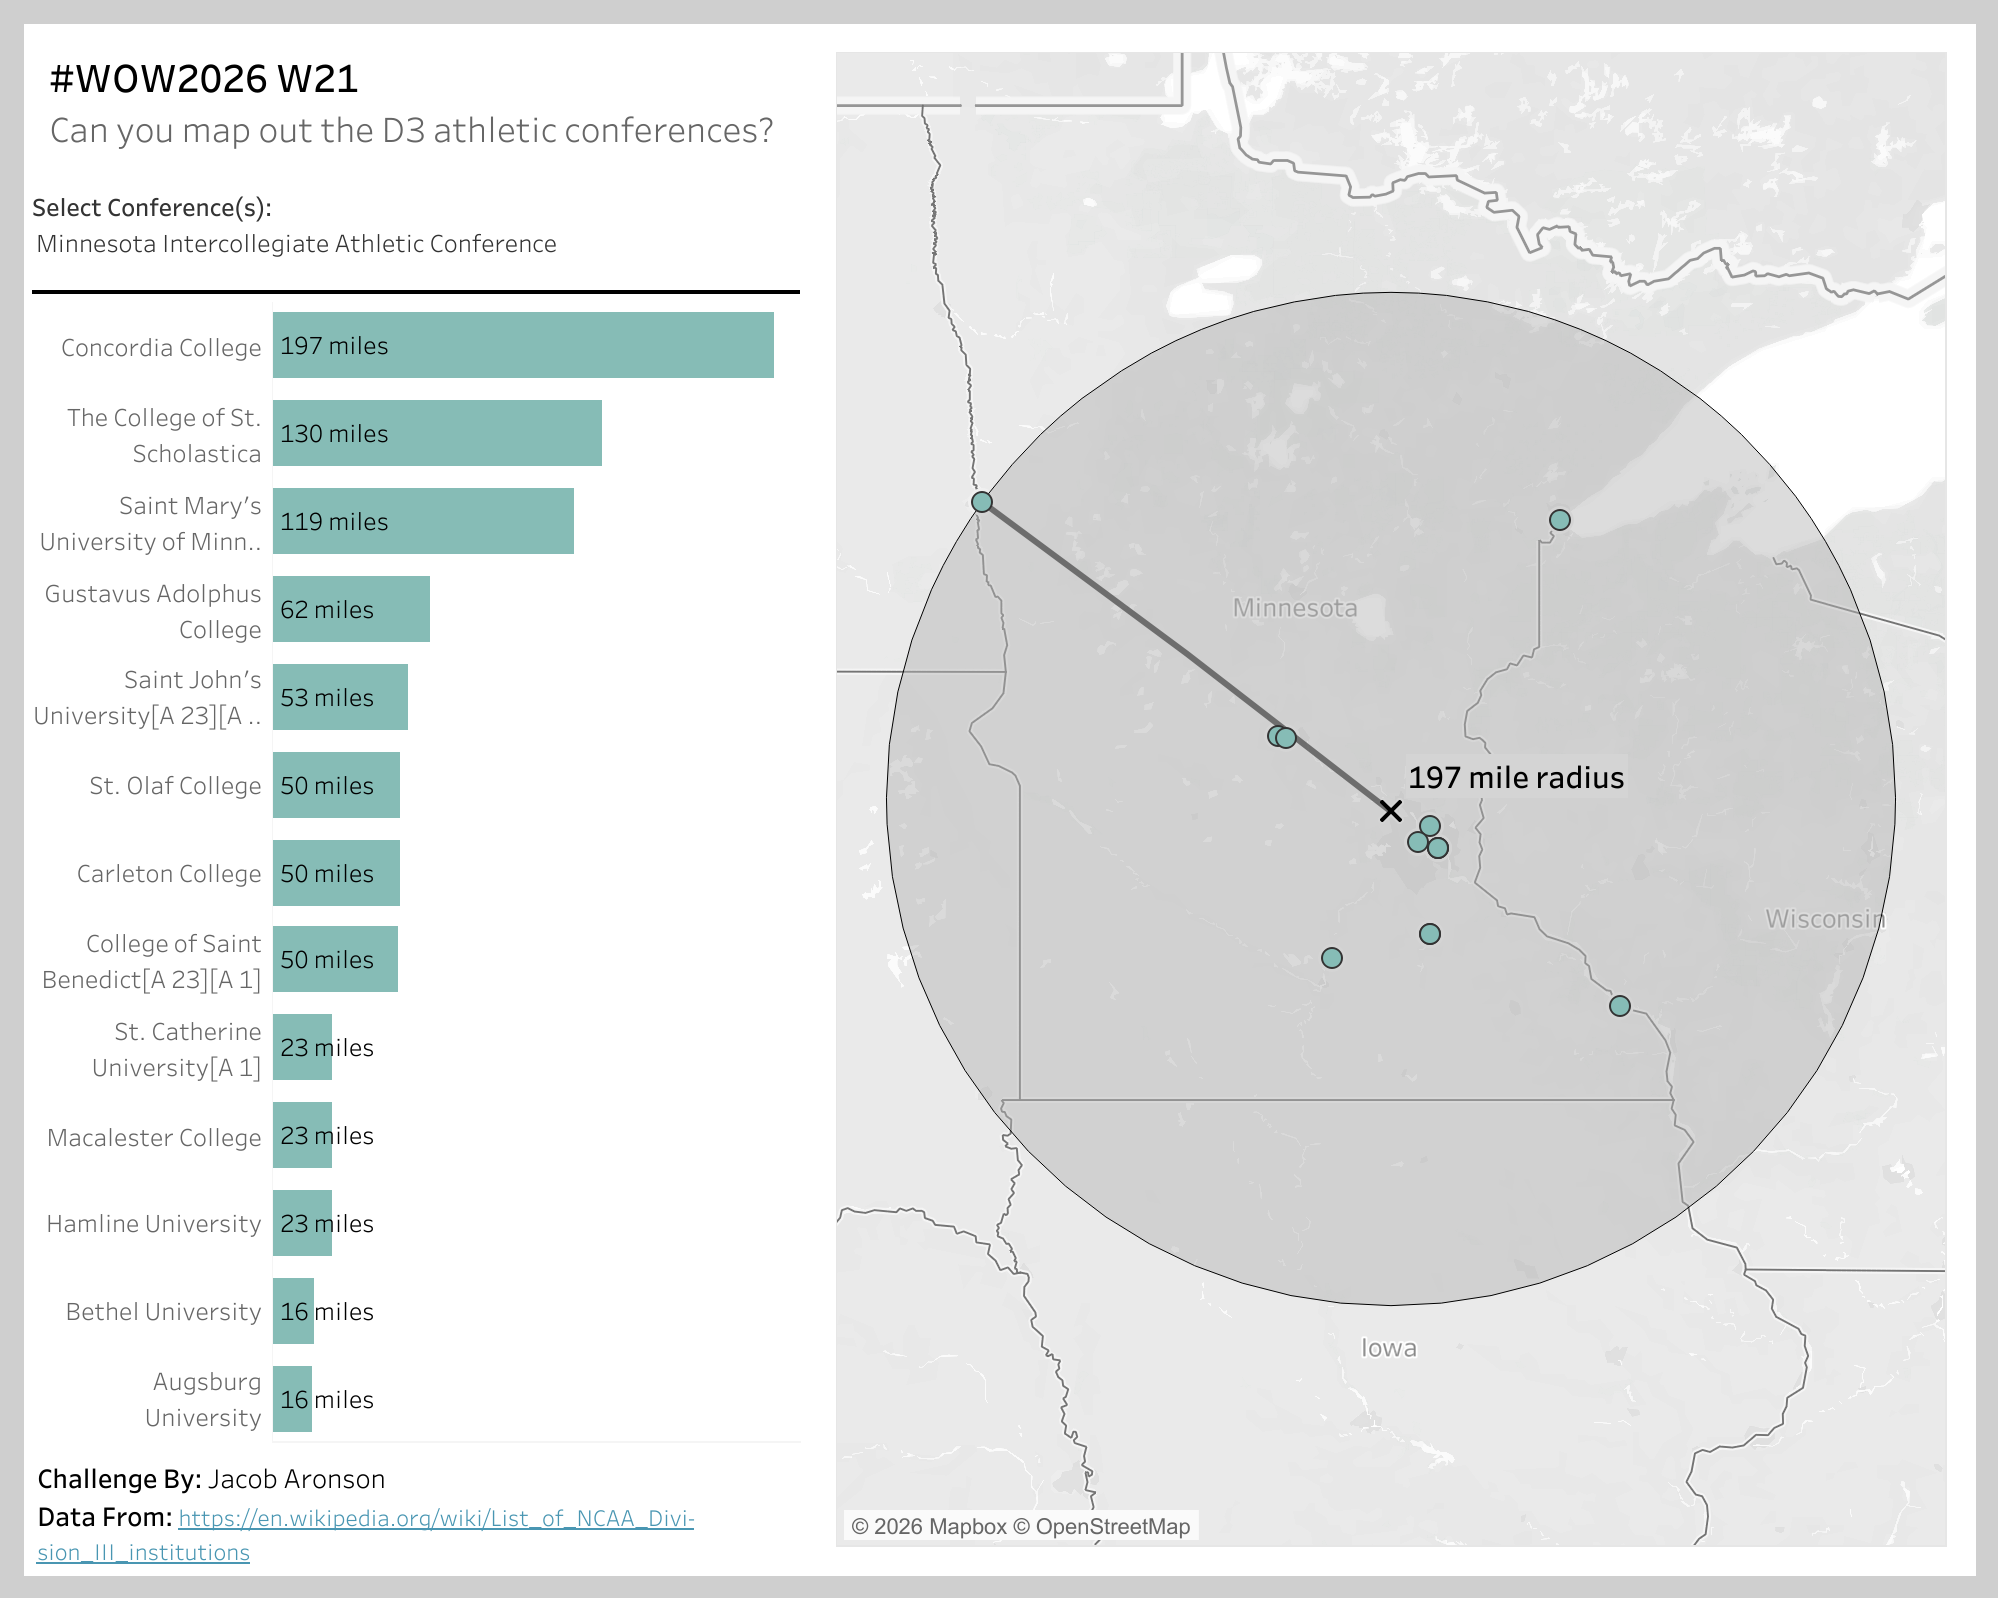
This week’s challenge puts the spotlight on some of America’s lesser known colleges and universities – those that compete at the D3 athletic level (including my Alma Mater, Carleton College). The 400 schools are organized into ~44 conferences so that teams that are close to each other geographically mostly compete against each other. At least, that is the ideal scenario, but it does not always end up that way in practice. Using several of Tableau’s spatial capabilities, let’s map out the sizes of the D3 conferences and find out if they are really geographically optimized!
When you publish your solution on Tableau Public make sure to take the time and include a link to the original inspiration. Also include the hashtag #WOW2026 in your description to make it searchable!