#WOW2026 | Week 18 | Let’s Visualize TC25! (#TC26 Live Edition)

Introduction

This challenge was released at the TC26 Workout Wednesday session.
Whether you’re here in the room or finding it later, I hope you’ll have fun!

In this challenge, we’ll visualize the sessions of Tableau Conference itself. Three difficulty tiers are available, so pick the one that matches your confidence and give it a try. Let’s dive right in!

Requirements

Basic

  • Dashboard size: 1000 x 800
  • Use the provided sessions.csv dataset
  • Flag a session as AI-related when any of the following match:
    • its title contains AI or Agent
    • or its topic is Agentic Analytics or Artificial Intelligence
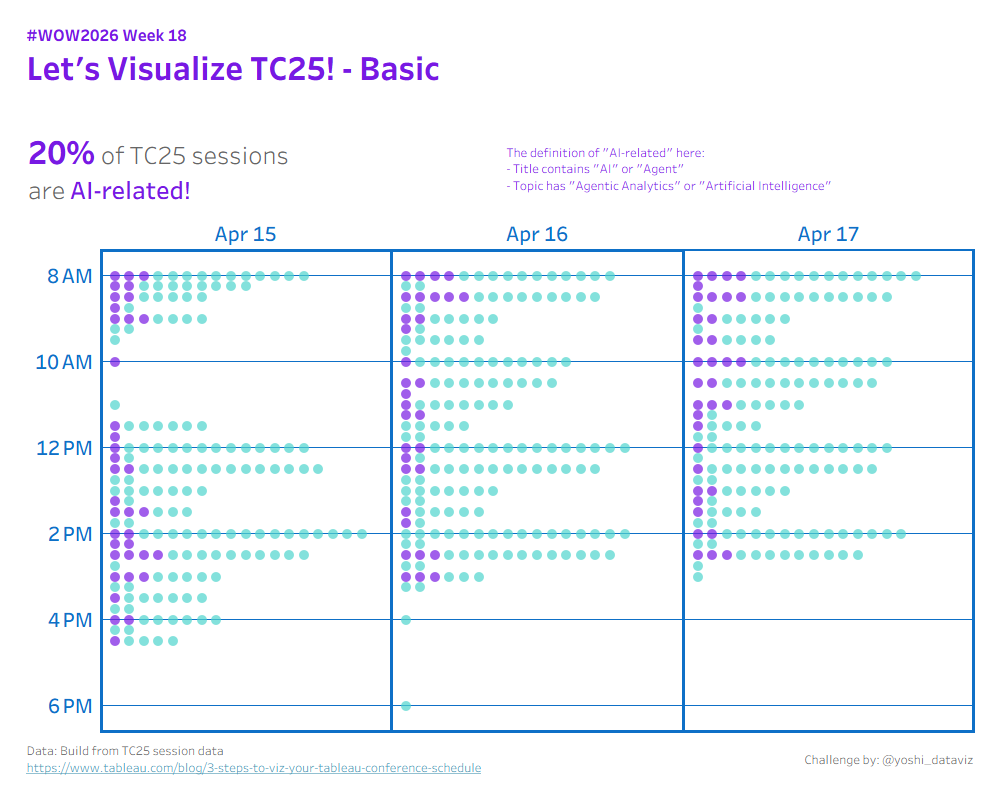
  • Display a BAN showing the share of TC25 sessions that are AI-related
  • Build a calendar:
    • Vertical axis: session start time
    • Within the same start time, arrange sessions so AI-related ones cluster together
  • Colors are up to you
  • (Optional) Match the grid lines and tooltips as closely as possible


Bonus

In addition to the Basic requirements:

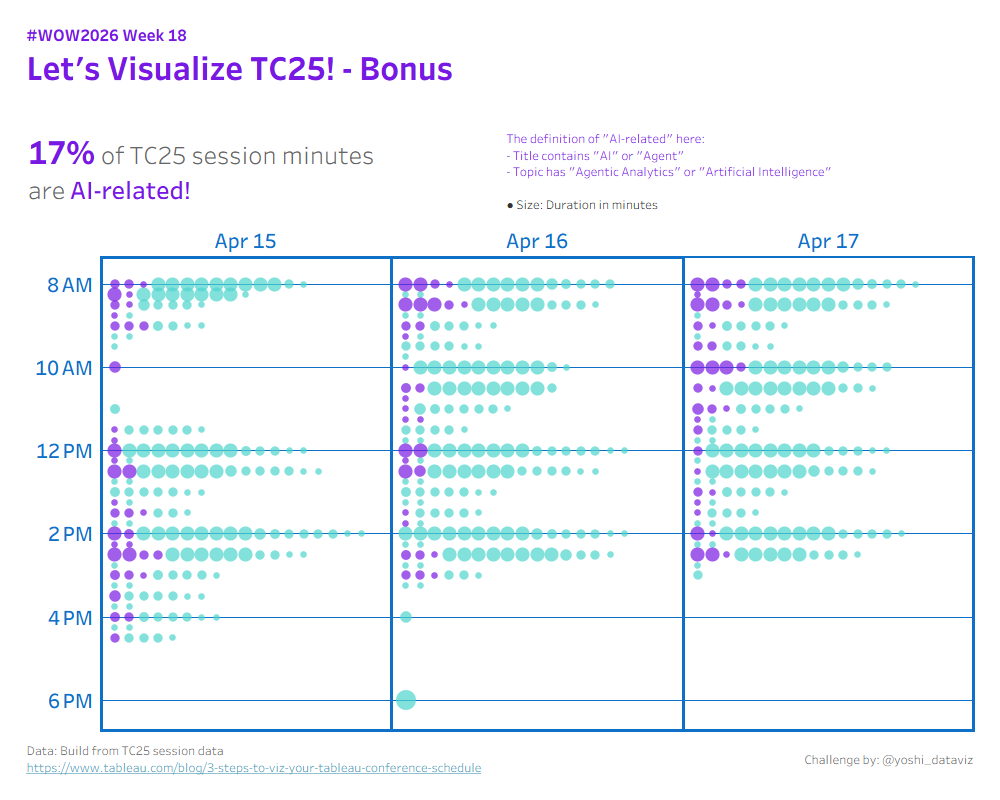
  • Recalculate the BAN using total session duration in minutes instead of session count
  • Size each circle by its session duration
  • Within each day’s start-time row, sort circles by duration, resetting the order between the AI-related group and the non-AI group


Extreme

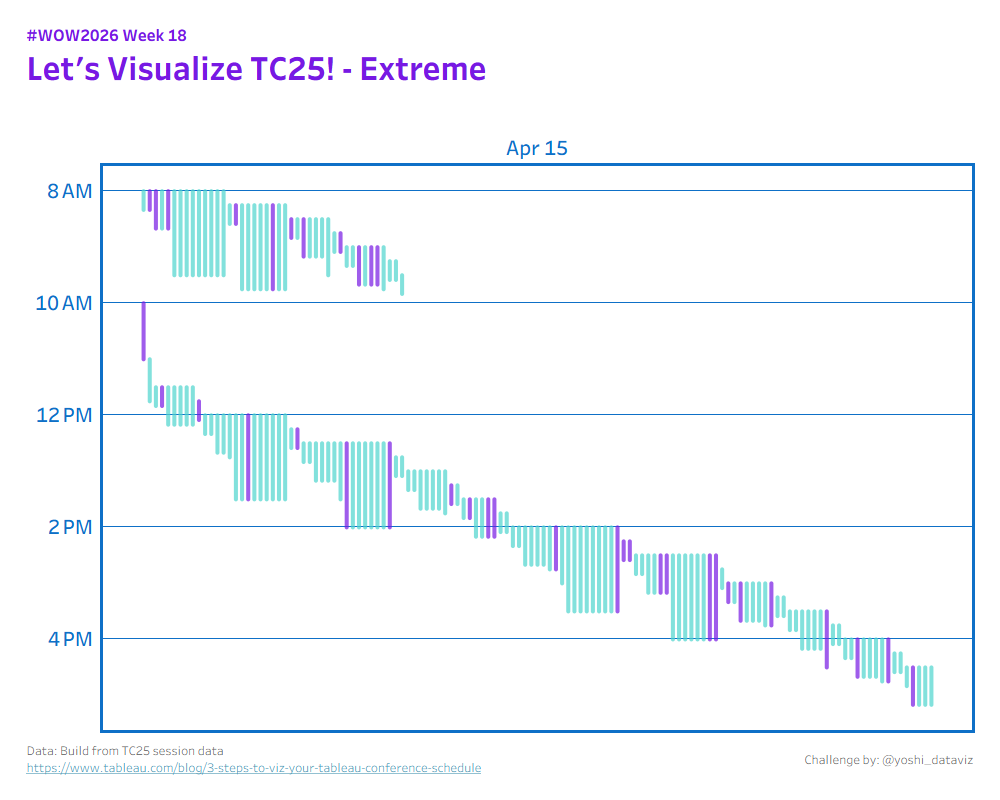
  • Build the calendar as a space-efficient Gantt chart where each session is a vertical line from its start to its end time on the time axis
  • Filter the data to April 15 sessions only
  • When sessions overlap, place them side-by-side in adjacent columns
  • When the overlap chain breaks, snap the next session back to the leftmost column

Hint:

    • Combine the provided minutes.csv with the sessions for data densification
    • Overlap is defined as: current session’s start time ≤ previous session’s end time
    • You’ll need nested table calculations and PREVIOUS_VALUE()

Dataset

This challenge uses a dataset built from the TC25 session data, originally shared in this Tableau blog post.
You can download the data here (Google Drive).
 

Attribute

When you publish your solution on Tableau Public make sure to take the time and include a link to the original inspiration.  Also include the hashtag #WOW2026 in your description to make it searchable!

Share

Solution

Interactive