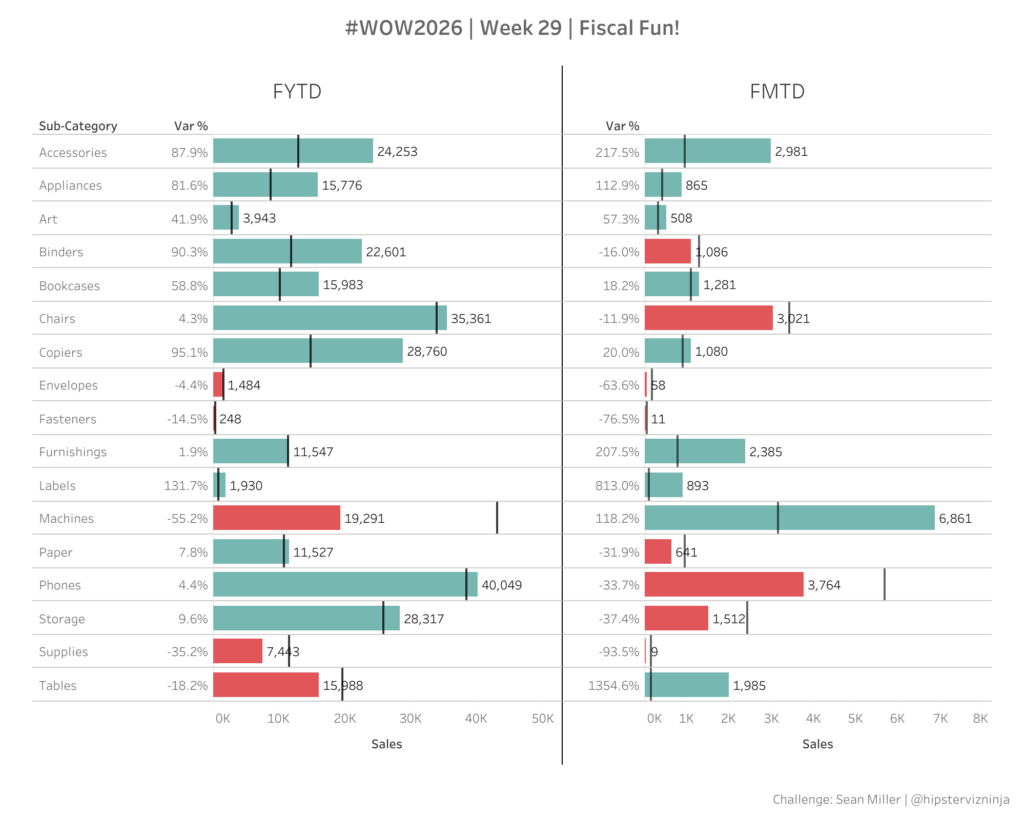
Author name: Sean Miller

#WOW2026 | 23 | Fun with Gantt Charts

Introduction For the week’s challenge we’re looking at Gantt charts! Gantt chart don’t have to necessarily show timeline data. In Tableau, they can be used to show “floating” bar charts. Which can be very powerful in certain use cases. This challenge looks at historical American Football Super Bowl betting odds and game results. In this […]

#WOW2026 | 23 | Fun with Gantt Charts Read More »

Tableau, Workout Wednesday

#WOW2026 | 15 | Mekko charts and offset labels

Introduction Welcome to week 15 and week 3 of Community month! I’m so thrilled to be partnering with Tableau Visionary HOF’er, Linsday Betzendahl! 6 months ago or so, while chatting, she mentioned she was messing around with stacked bars originally for the offset labels but determined that the Mekko concept was actually where she had

#WOW2026 | 15 | Mekko charts and offset labels Read More »

Tableau, Workout Wednesday

#WOW2026 week 8: DZV and Filter Actions

Introduction Welcome to week 9! I recently had a client reach out about some advanced navigation and filtering requests for their dashboard. It combined elements of Dynamic Zone Visibility and different types of filter actions. And I thought it was the perfect challenge for this week so here ya go! Click to open in Tableau

#WOW2026 week 8: DZV and Filter Actions Read More »

community, Tableau, Workout Wednesday

#WOW2025 | Week 37 | Let’s Practice Table Calcs!

Introduction This week we’re going easier than typical. We’re going back to the basics. We’re going to practice our Table calculations in a simple easy dashboard. If you wanna take it up a notch, feel free but this week is keeping it simple. So here go! Let’s practice Table Calcs This week’s challenges highlights data

#WOW2025 | Week 37 | Let’s Practice Table Calcs! Read More »

Tableau, Uncategorized

#WOW2025 | Week 18 | Can you Filter or Drill to Details?

Introduction I’m so excited to be back for another WOW challenge! Fresh off the heels of Tableau Conference, I’m back in dashboard mode. This week I was faced with an interesting use case that I needed to accomplished and after I did, I knew it would make a great challenge. So here we go! So

#WOW2025 | Week 18 | Can you Filter or Drill to Details? Read More »

Tableau, Uncategorized, Workout Wednesday

#WOW2025 | 9 | Binary Parameters

Introduction Welcome to week 9 – and just like that we’re already welcoming March ????. I’m so excited to be partnering with fellow Kansas Citian & Tableau Visionary, Felicia Styer, for this week’s challenge. Recently she created a framework for what she calls “binary parameters” which allows for a solution for multi-select parameters. The goal

#WOW2025 | 9 | Binary Parameters Read More »

Tableau, Workout Wednesday

#WOW2025 | Week 2 | Visualizing Ranges

Introduction One of things that I really enjoy about using Tableau is finding interesting charts “in the wild” and attempting to replicate them. Last month, I saw a Power BI WOW challenge from Meagan that looked really interesting and I wanted to try it out.  So here go! Can you visualize ranges?  Click to open

#WOW2025 | Week 2 | Visualizing Ranges Read More »

Tableau, Uncategorized, Workout Wednesday

#WOW2024 | 48 | Can you make a Candle Line Chart?

Introduction Hey there #DataFam! Welcome to week 48 of 2024…that’s wild when you think about it. That means that we have 47 other challenges already this year. So what are doing this week? We’re gonna play different mark types on dual axis. This week’s challenge is something I’m calling a “candle line” chart. Check it

#WOW2024 | 48 | Can you make a Candle Line Chart? Read More »

Tableau, Workout Wednesday