Gantt Chart

#WOW2026 | 23 | Fun with Gantt Charts

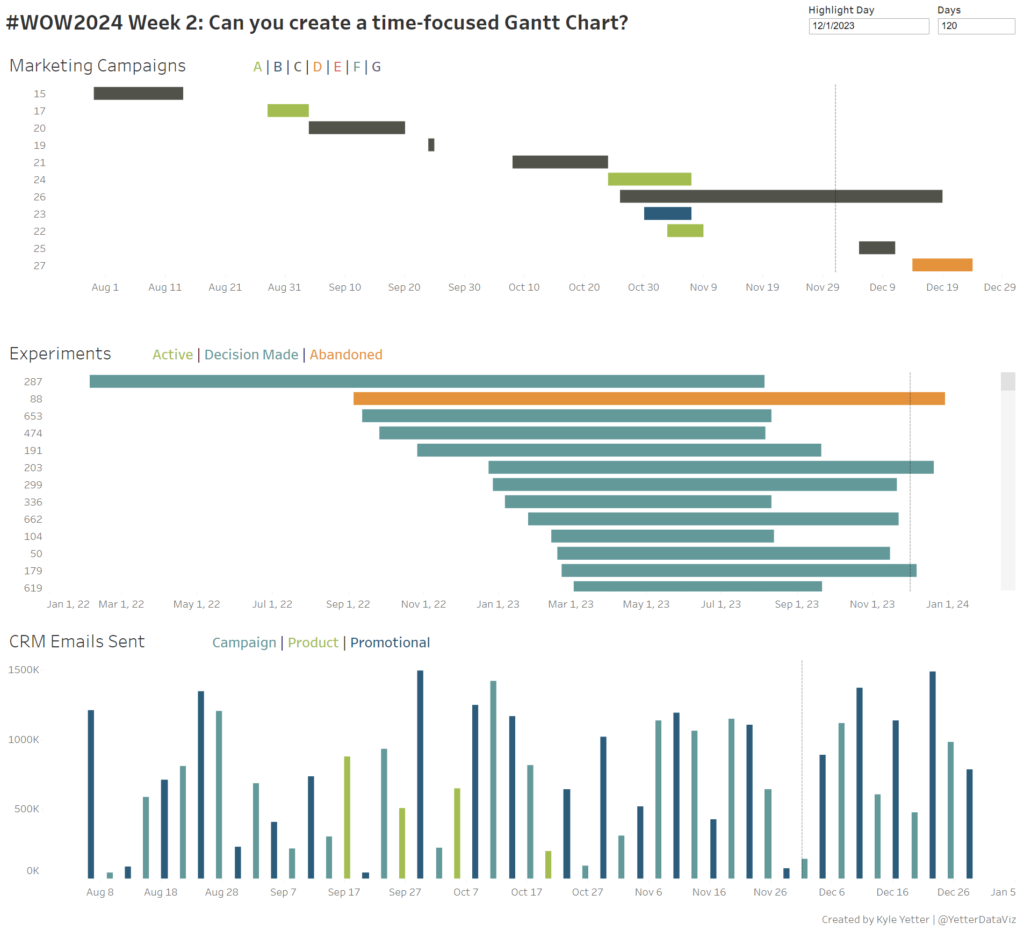
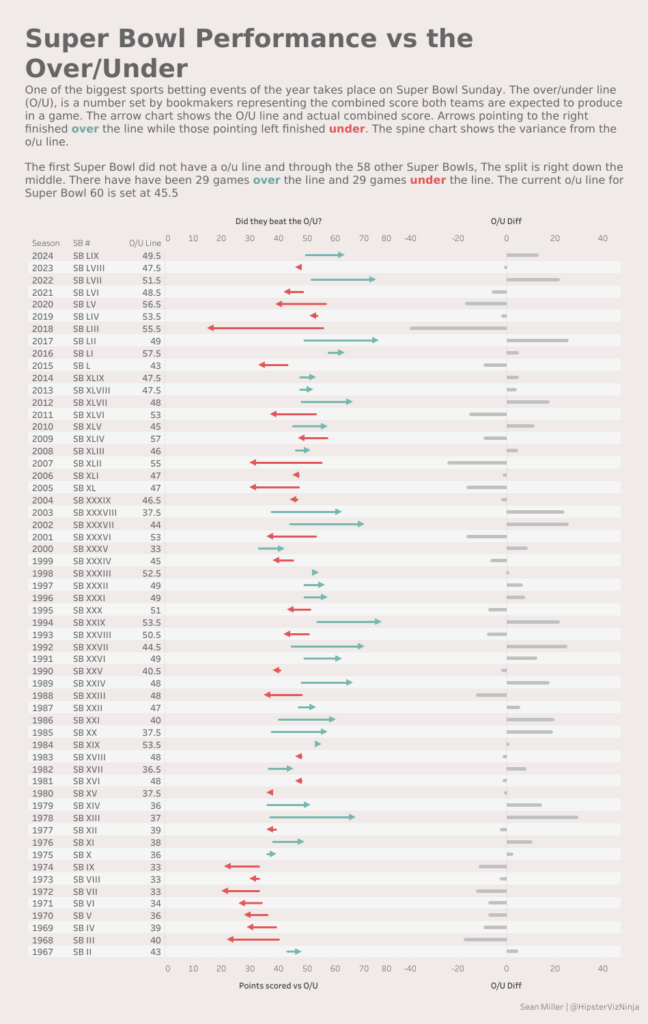
Introduction For the week’s challenge we’re looking at Gantt charts! Gantt chart don’t have to necessarily show timeline data. In Tableau, they can be used to show “floating” bar charts. Which can be very powerful in certain use cases. This challenge looks at historical American Football Super Bowl betting odds and game results. In this […]

#WOW2026 | 23 | Fun with Gantt Charts Read More »

Tableau, Workout Wednesday

#WOW2024 | Week 2 | Can you create a time-focused Gantt Chart?

Introduction This week’s challenge is another from recent experience. As we have spikes or drops with various metrics, we found that we often asked the same questions…What marketing campaigns were happening at that time? Did we send any big email campaigns around then? Did we launch a new product feature or experiment? With all these

#WOW2024 | Week 2 | Can you create a time-focused Gantt Chart? Read More »

Tableau, Workout Wednesday