
pareto

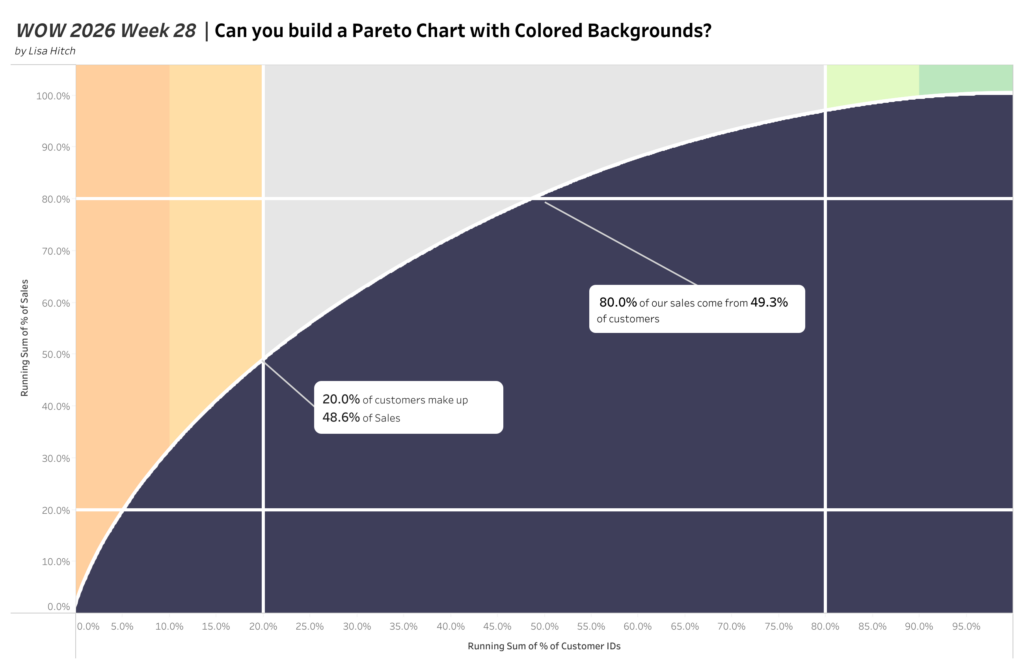
2026 | Week 28 | Can you build a Pareto Chart with Colored Backgrounds?

Introduction This week we have a challenge by Lisa Hitch, Coach of the New York Data School and Winner of the Tableau Conference Tips Battle.  This week we’re putting a fresh spin on a classic chart: the Pareto chart! The Pareto principle (also known as the 80/20 rule) tells us that roughly 80% of outcomes […]

2026 | Week 28 | Can you build a Pareto Chart with Colored Backgrounds? Read More »

Tableau, Workout Wednesday
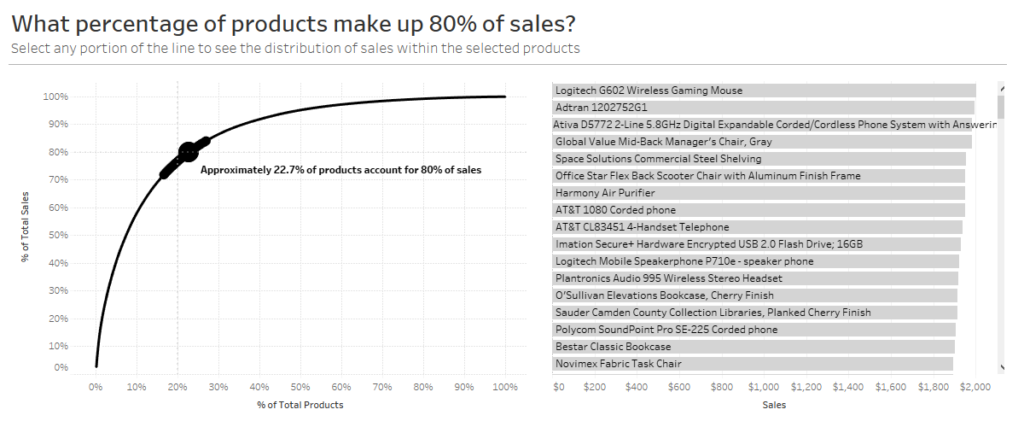
2019 Week 8: What percentage of products make up 80% of sales?

For this week’s workout, we look at one of my favorite chart types, the pareto. I love the pareto chart as a data exploration resource, and also as a powerful analytic resource. If you aren’t familiar with the pareto, the purpose is to see what % of x, makes up what % of y, with

2019 Week 8: What percentage of products make up 80% of sales? Read More »

Tableau, Workout Wednesday
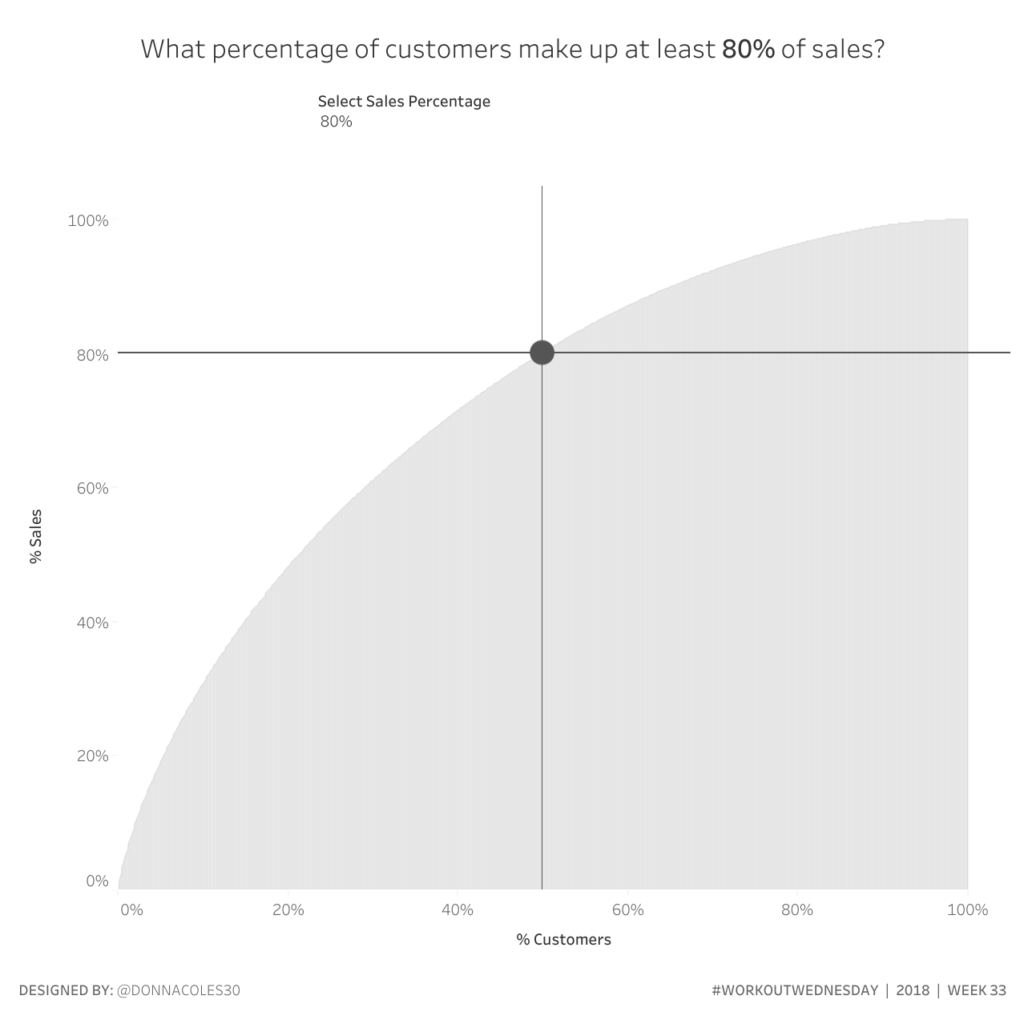
Week 33: What customers make up XX% of sales?

August Community Submission Month Welcome to community submission month. For all 5 of those weeks we’ll have our favorite community submissions as challenges. FYI: You can still submit here.     Community Submission Challenge #3: Donna Coles Donna is located in Didcot, Oxfordshire in the UK. She is a Business Analyst for RM Education and

Week 33: What customers make up XX% of sales? Read More »

Tableau, Workout Wednesday