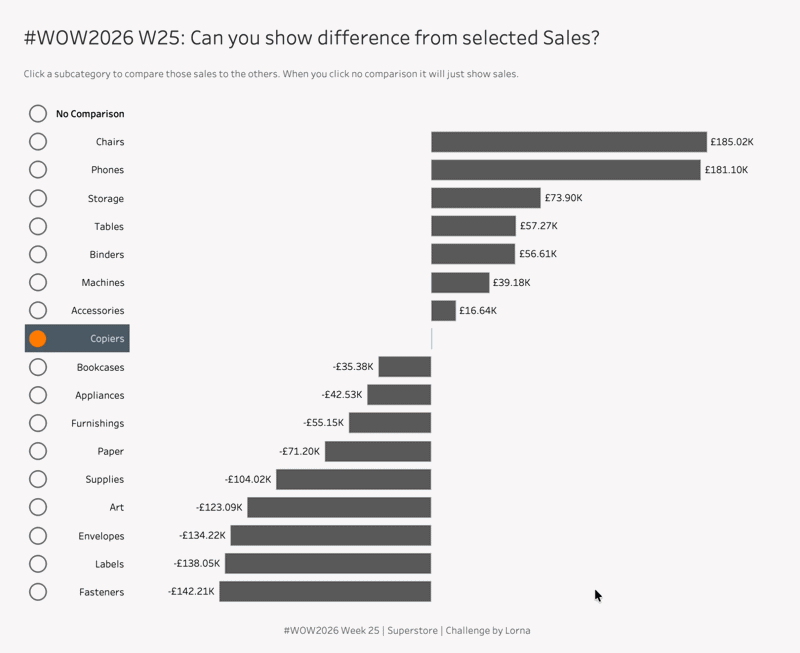
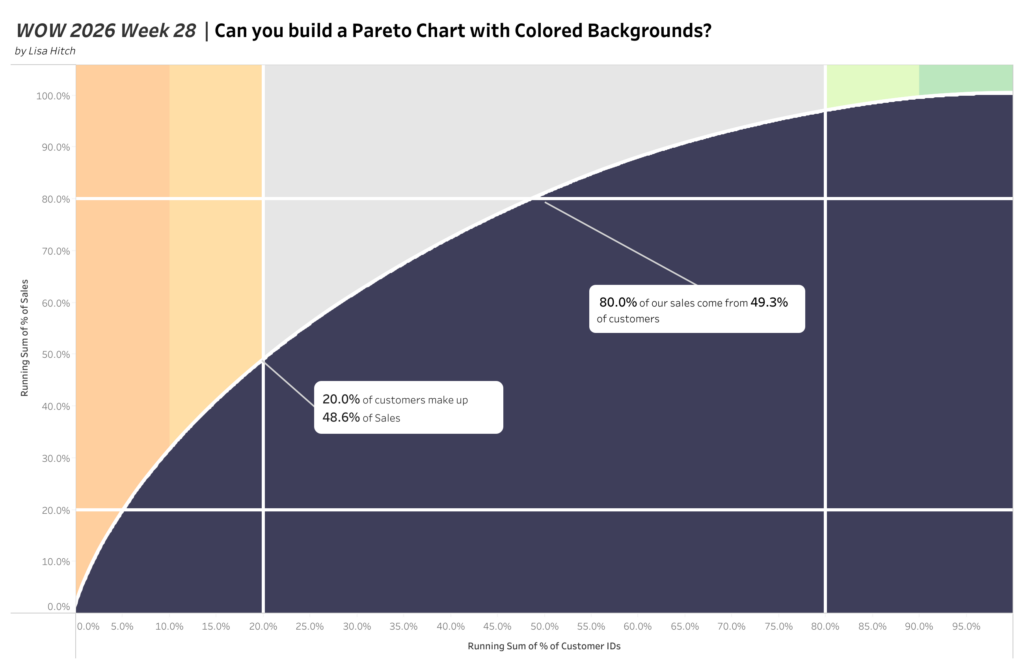
Author name: Lorna Brown

#WOW2026 W21: Can you map out the D3 athletic conferences?

Introduction This weeks challenge comes from a Data School Consultant  – Jacob Aronson This week’s challenge puts the spotlight on some of America’s lesser known colleges and universities – those that compete at the D3 athletic level (including my Alma Mater, Carleton College).The 400 schools are organized into ~44 conferences so that teams that are […]

#WOW2026 W21: Can you map out the D3 athletic conferences? Read More »

Tableau, Workout Wednesday

#WOW2026 | Week 19 | Can you visualise Customer Spend Insights?

Introduction I was struggling to think of a challenge for this week, so I went back to the archives and found this one. This is looking at Customer Spend Insights, which is looking at their first & second purchase, and whether they are deemed as Outliers or not You have the option to choose between

#WOW2026 | Week 19 | Can you visualise Customer Spend Insights? Read More »

Tableau, Workout Wednesday

#WOW2026 | Week 11 | Can you use layout containers?

Introduction Every week I’m reminded at how much people struggle with containers in Tableau. So I thought why not make another challenge to see how people get on.  I’ll be giving you the solution file and it’s your job to recreate the same item hierarchy Click to open in Tableau Public Requirements Dashboard Size: 1200×800

#WOW2026 | Week 11 | Can you use layout containers? Read More »

Tableau, Workout Wednesday

#WOW2026 | Week 4 | Can you create a dynamic moving average?

Introduction Happy New Year everyone, my turn comes round awfully quickly these days. As it’s still the start of 2026, I didn’t want to go too hard too quick. Hopefully this isn’t too bad. We are flexing our Table Calc, Date and Order of Operations skills in this challenge. Have fun! Click to open in

#WOW2026 | Week 4 | Can you create a dynamic moving average? Read More »

Tableau, Workout Wednesday

#WOW2025 W49: Can you create breadcrumbs for filters?

Introduction I thought about this challenge after I had a question about doing it, usually where these ideas come from. Tableau don’t make this easy and unfortunately you have to hack it a little bit. But today we are going to create breadcrumbs in Tableau especially when using filters Click to open in Tableau Public

#WOW2025 W49: Can you create breadcrumbs for filters? Read More »

Tableau, Workout Wednesday

#WOW2025 | Week 40 | Can you create this Zoom and Reset Scatter Plot?

Introduction I had a thought last week about using the parameter driven axis ranges and whether they could be reset to the minimum and maximum. Turns out they can be, and hence this challenge.  Click to open in Tableau Public Requirements 1 sheet You’ll need: 4 parameters 4 LODs 1 colour calc (reference lines are

#WOW2025 | Week 40 | Can you create this Zoom and Reset Scatter Plot? Read More »

Tableau, Workout Wednesday

#WOW2025 Week 26: Can you create this seemingly simple line chart?

Introduction This may seem like a seeming normal line and area chart but I said “Why Tableau” numerous times when trying to create it.You want to be able to see the Top X customers per Quarter and what their percentage of total sales is. Click to open in Tableau Public Requirements Dashboard Size 800×800 1

#WOW2025 Week 26: Can you create this seemingly simple line chart? Read More »

Tableau, Workout Wednesday

#WOW2025 Week 19: Can you create stars & reference lines?

Introduction Some of you may have seen this challenge as I got my weeks all confused but here we go. Coming fresh off of Tableau Conference and I loved seeing different use cases and tricks. So part of this comes from a tips session with Nhung Lee. And well obviously some additional techniques because I

#WOW2025 Week 19: Can you create stars & reference lines? Read More »

Tableau, Workout Wednesday

#WOW2025 W12: Can you show the top X customers in EACH of the last 3 years and their contributions to Sales?

Introduction Starting the community month with a Challenge from a Data School Consultant Abby Poon. She came to me with a puzzle and we solved it together. The idea is you want to be able to see how the Top X customers are changing over the last 3 years (dynamically). Each year the top X

#WOW2025 W12: Can you show the top X customers in EACH of the last 3 years and their contributions to Sales? Read More »

Tableau, Workout Wednesday