This week’s challenge is inspired by one of the new features announced at Devs on Stage at the recent Tableau Conference. Devs on Stage unveiled nearly 30 new features. Chart Layers stole the show for me, but I’m also genuinely excited about Data Driven Formatting—the ability to dynamically change font size, container size, color, and more based on your data. It feels like it will solve so many of the day-to-day challenges we face when building real-world dashboards. I just can’t wait! But waiting isn’t really my style—so let’s see how far we can get with the features we already have. If you’ve ever worked with survey data, you’ve probably struggled with how to display free-text responses on a dashboard. When you want to show short answers like “Nothing in particular” alongside long, passionate write-ups in the same table, it would be ideal to adjust row height per row, just like in Excel. Using sightseeing data from across Japan, let’s learn how to make row heights expandable in Tableau!
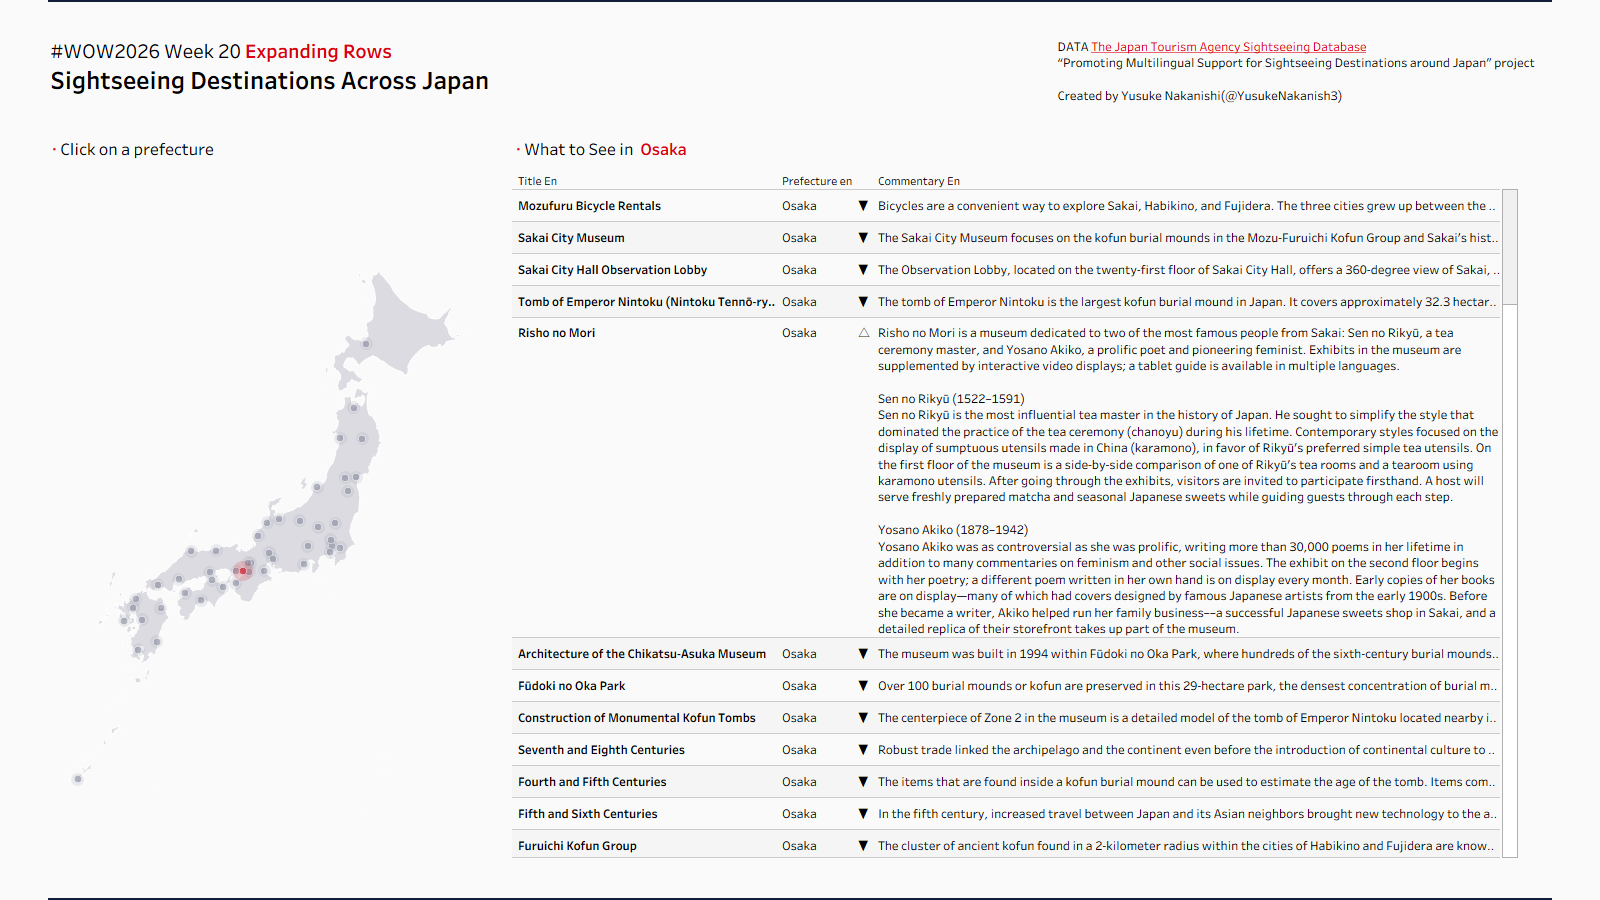
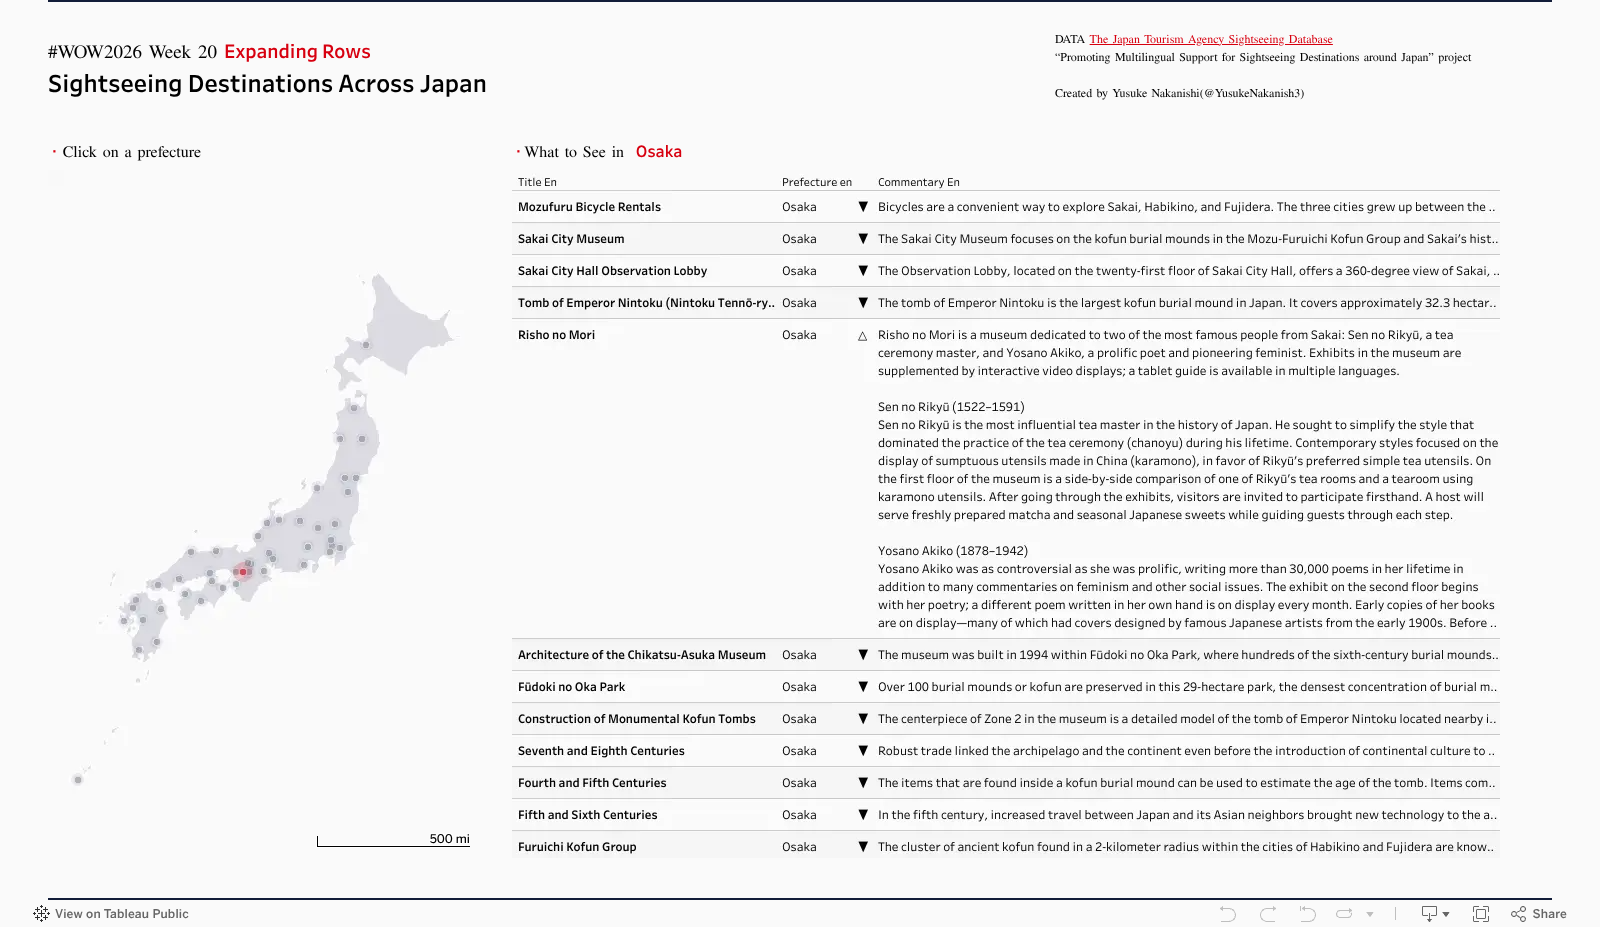
Build a text table showing No., destination name (Title En), Prefecture, and commentary (Commentary En)
Display a ‘△’ / ‘▼’ toggle button to the left of the commentary—clicking it should expand the commentary field for that destination
Map
Create a map of Japan that allows the user to select a Prefecture
The selected Prefecture should filter the text table
Other
Colors, fonts, tooltips, and so on are all up to you
For those who want to go further: I’ve sneaked in a few of my favorite tips—things like the map styling and the button header treatment—that wouldn’t quite stand alone as a Workout. Give them a try, or take a peek inside the workbook!
When you publish your solution on Tableau Public make sure to take the time and include a link to the original inspiration. Also include the hashtag #WOW2026 in your description to make it searchable!