2026

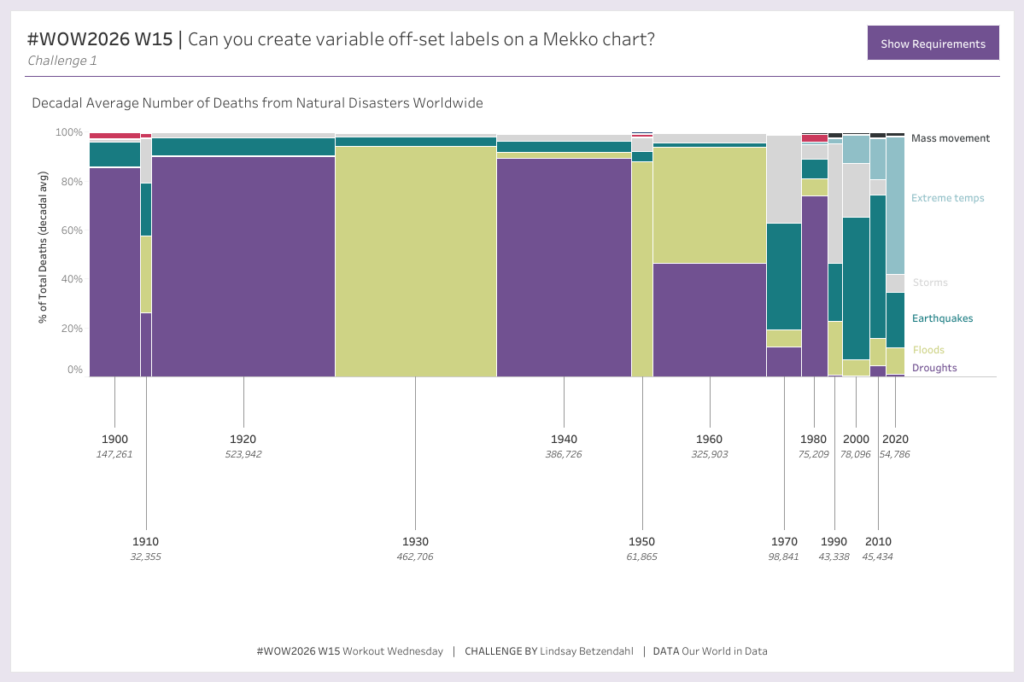
#WOW2026 | 15 | Mekko charts and offset labels

Introduction Welcome to week 15 and week 3 of Community month! I’m so thrilled to be partnering with Tableau Visionary HOF’er, Linsday Betzendahl! 6 months ago or so, while chatting, she mentioned she was messing around with stacked bars originally for the offset labels but determined that the Mekko concept was actually where she had […]

#WOW2026 | 15 | Mekko charts and offset labels Read More »

Tableau, Workout Wednesday
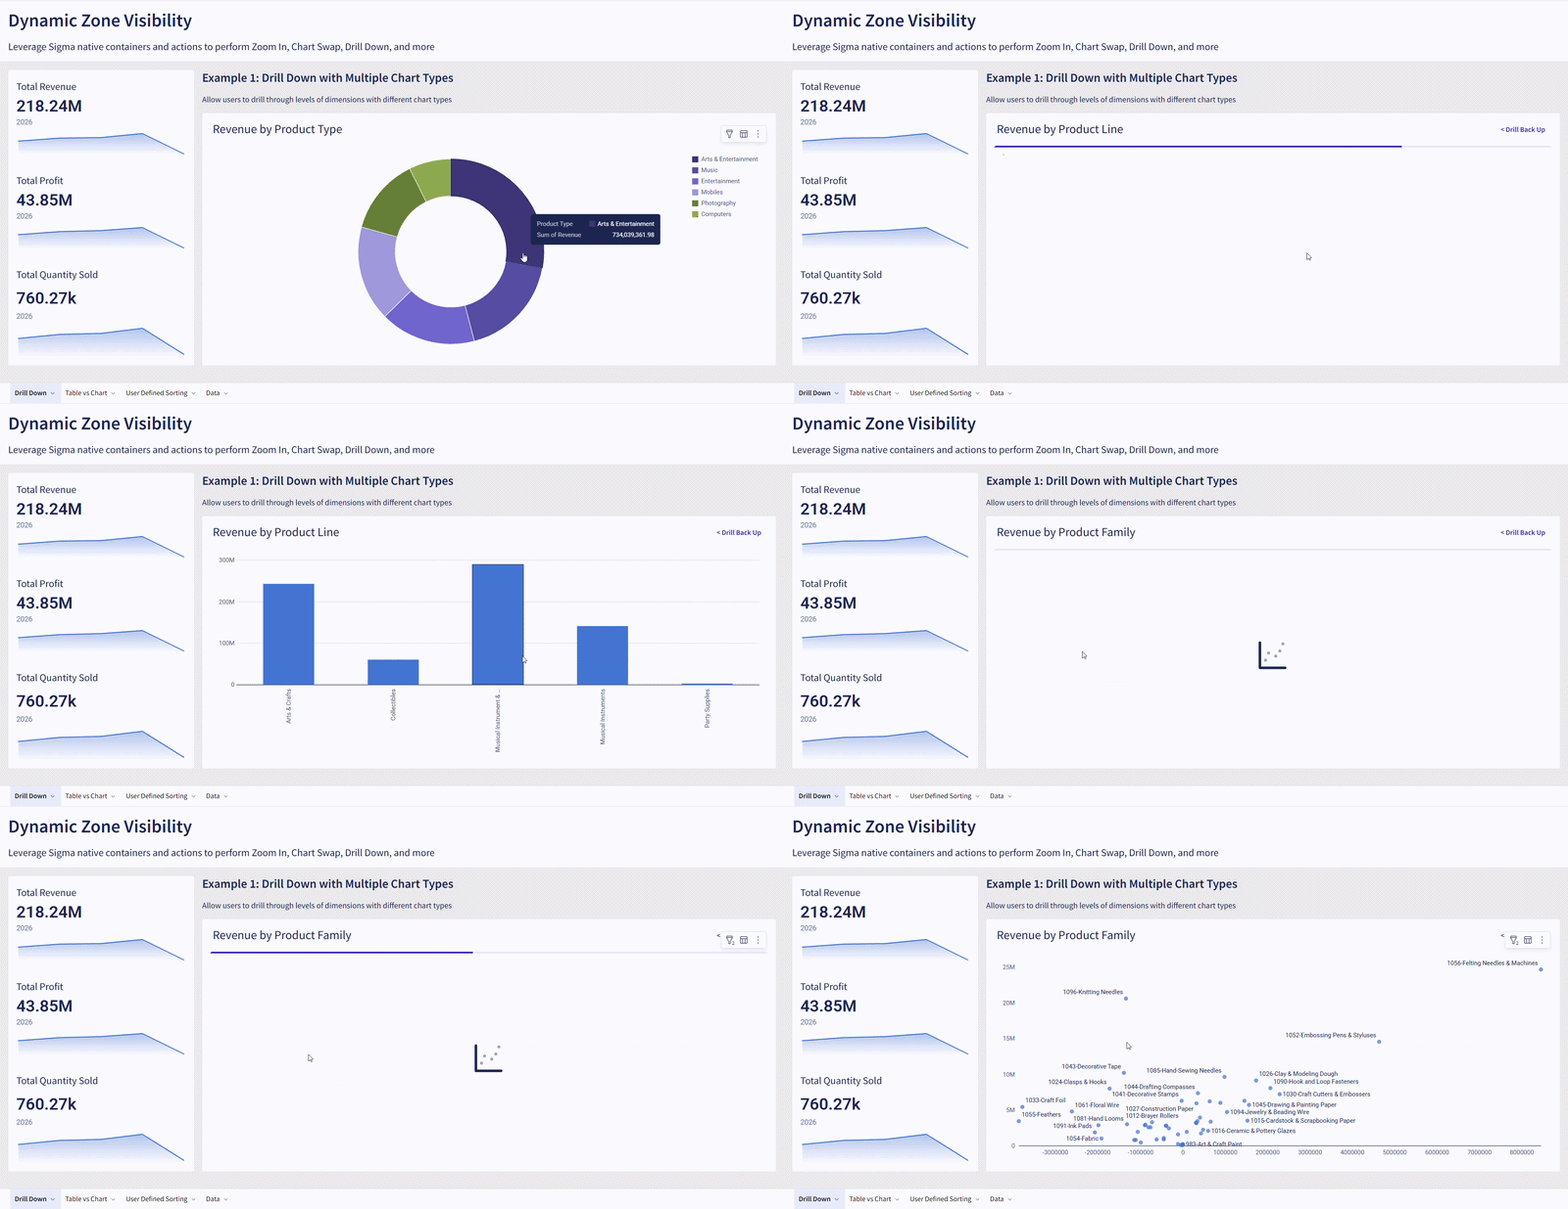
2026 Week 14 | Sigma: Dynamic Zone Visibility

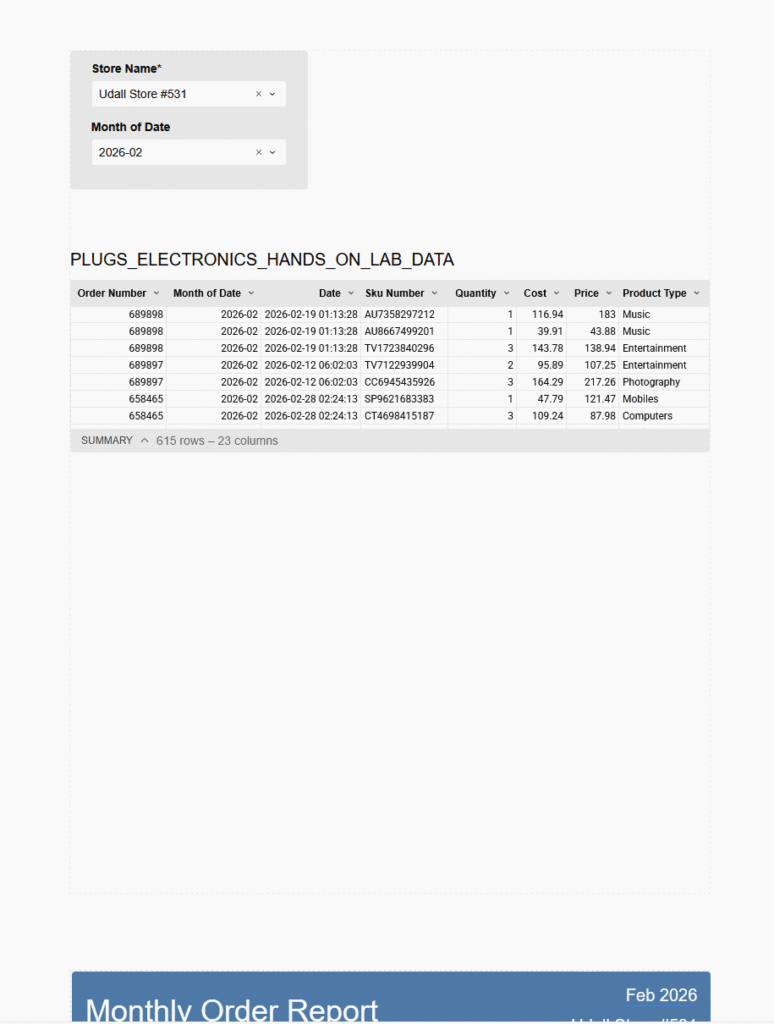
Introduction This week, we are picking up the momentum from the map challenge last week, by taking a deep dive into Dynamic Zone Visibility. This project will provide you an understanding of developing dynamic zones in Sigma for the ultimate user experience you want to bring to your audience. Examples include: Drill down, Chart Swap,

2026 Week 14 | Sigma: Dynamic Zone Visibility Read More »

Sigma, Workout Wednesday

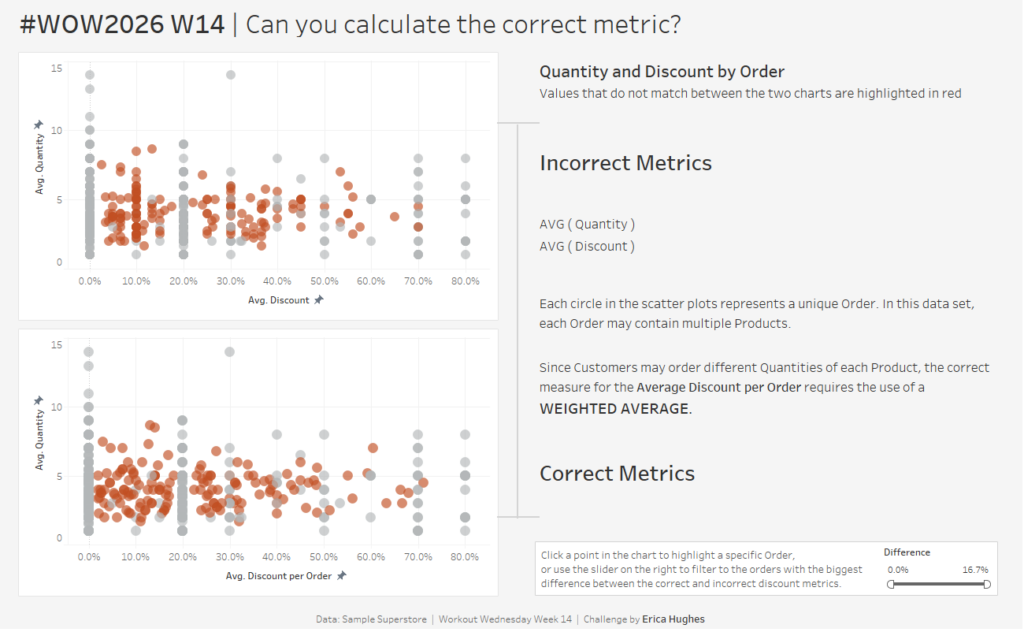
#WOW2026 | Week 14 | Can you calculate the correct metric?

Introduction This week’s challenge may not be too difficult for some of you, but I created it in order to bring attention to an essential skill – calculating weighted averages. As data analysts, it’s our responsibility to ensure that the data we display is not misleading or innacurate. I didn’t spend too much time explaining

#WOW2026 | Week 14 | Can you calculate the correct metric? Read More »

community, Tableau, Workout Wednesday

2026 Week 14 | Power BI: Drive insights with a simple table

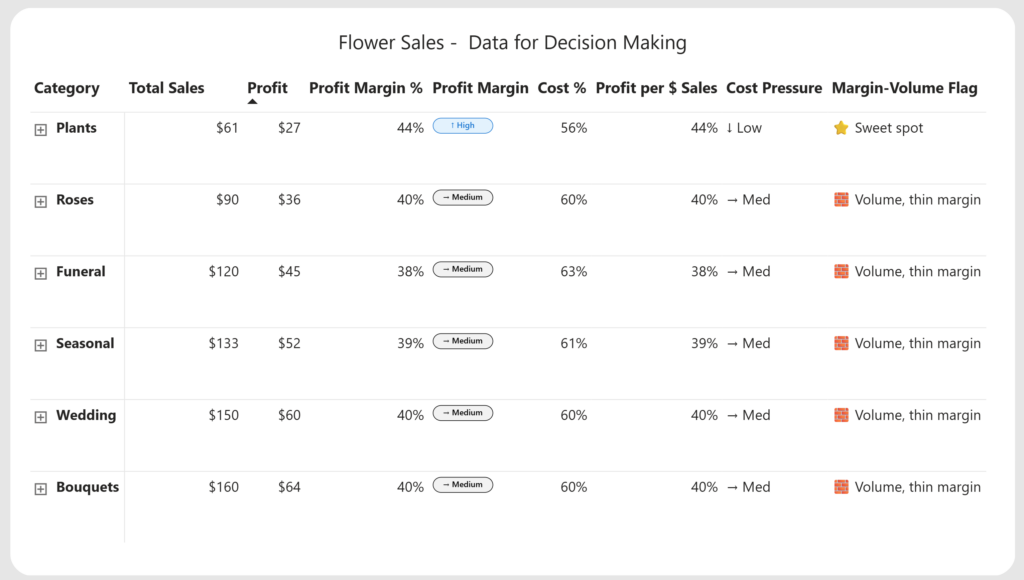
Introduction   This week we’re going to build everyone’s favorite Power BI visual, a table! Tables are often dismissed as boring or “not visual enough,” but they’re also one of the most powerful tools we have for making decisions – when they’re designed with intent. In this workout, we’ll start with a very simple table

2026 Week 14 | Power BI: Drive insights with a simple table Read More »

Power BI, Workout Wednesday

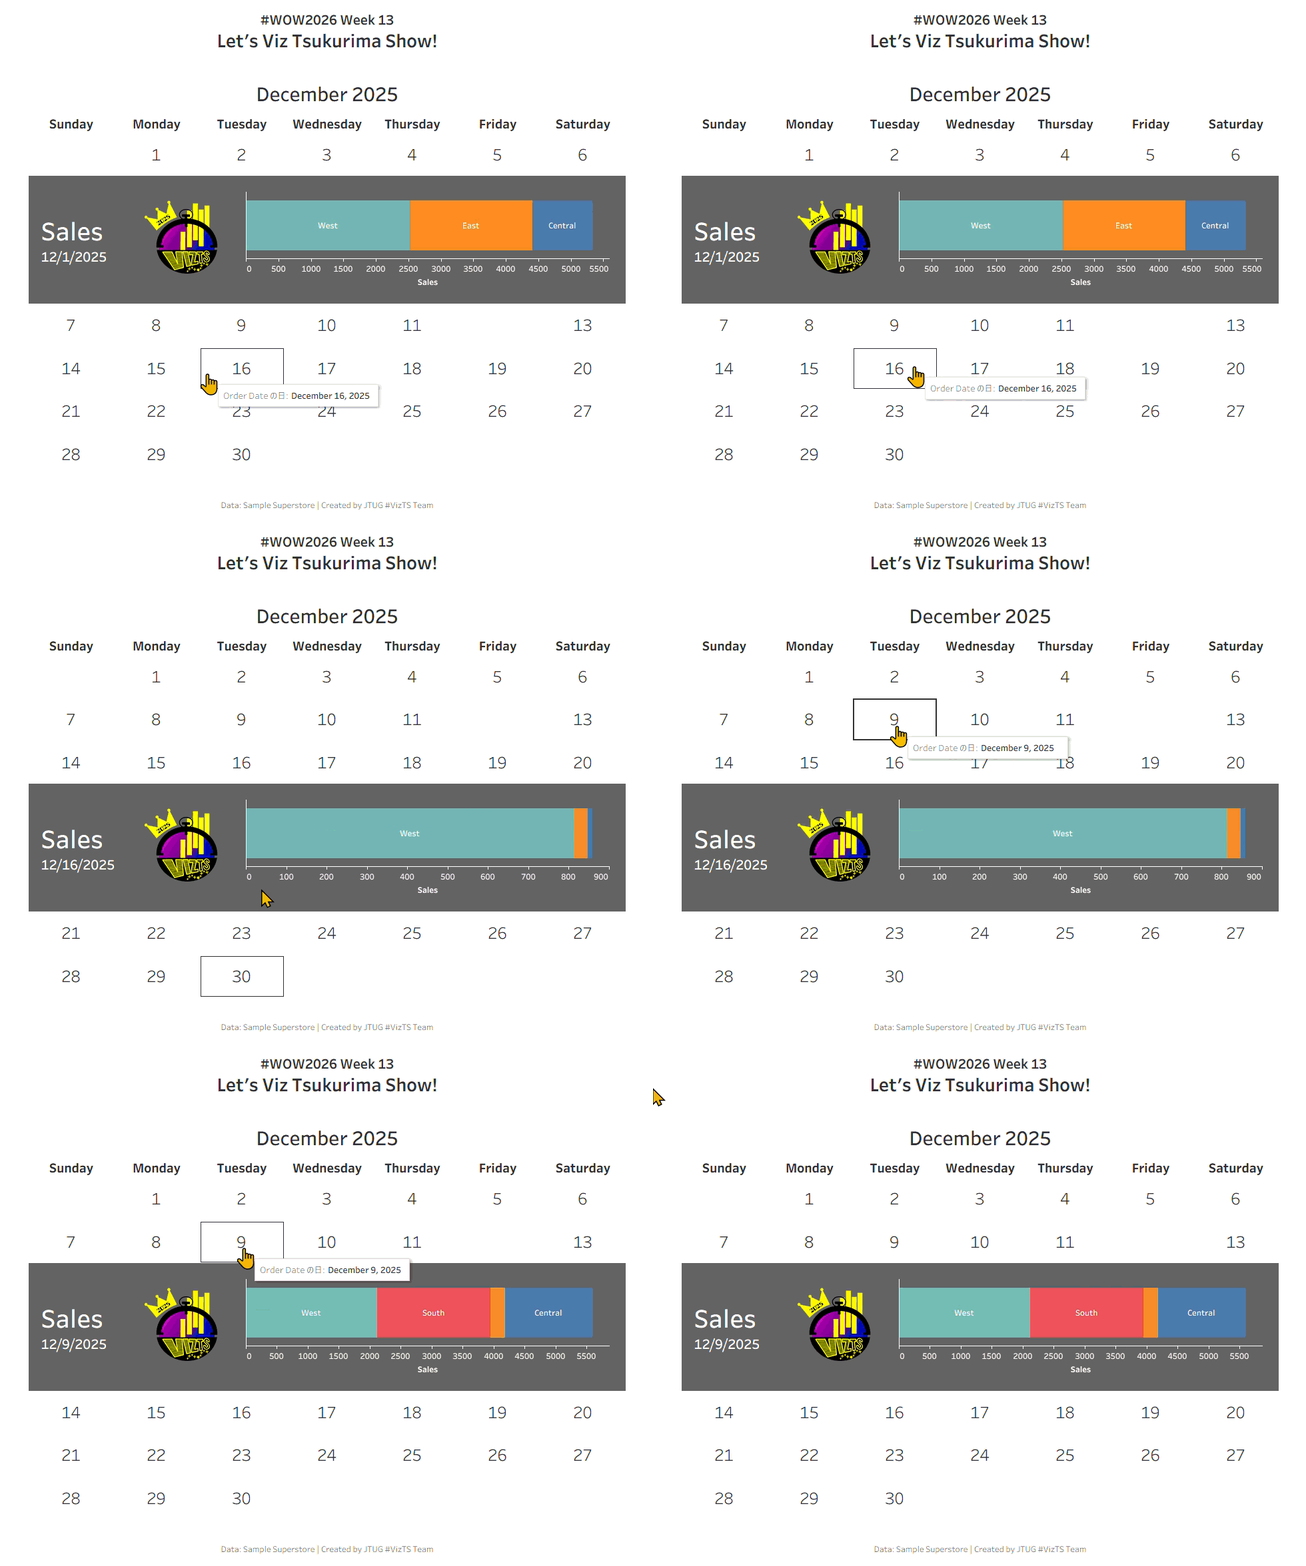
#WOW2026 | Week 13 | Let’s Viz Tsukurima Show!

Introduction Community Month is back! 🎉To kick things off, Hideaki Yamamoto and Tomoki Goda from Japan Tableau User Group are bringing a challenge inspired by one of the Japan Tableau User Group’s beloved events.Here’s a message from both of them! Meet “Viz Tsukurima Show!” (VizTS), a fan-favorite speed-viz event hosted by JTUG.It kicked off in

#WOW2026 | Week 13 | Let’s Viz Tsukurima Show! Read More »

Tableau, Workout Wednesday
2026 Week 12 | Power BI: Custom matrix subtotals and cards with categories

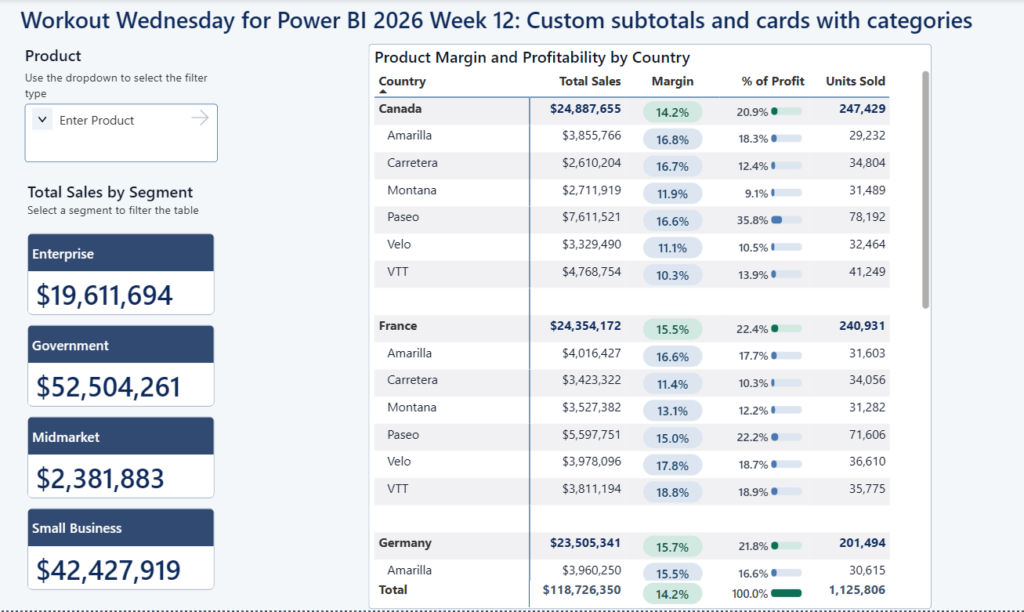
Introduction This week we are looking at some newer core visuals and formatting features: cards that in a segmented tile layout, a slicer that supports partial text matching, and a matrix where the percentage-of-total calculation changes meaning depending on whether you’re looking at a subtotal or a detail row.  The bonus challenge pushes into SVG-in-DAX

2026 Week 12 | Power BI: Custom matrix subtotals and cards with categories Read More »

Power BI, Workout Wednesday

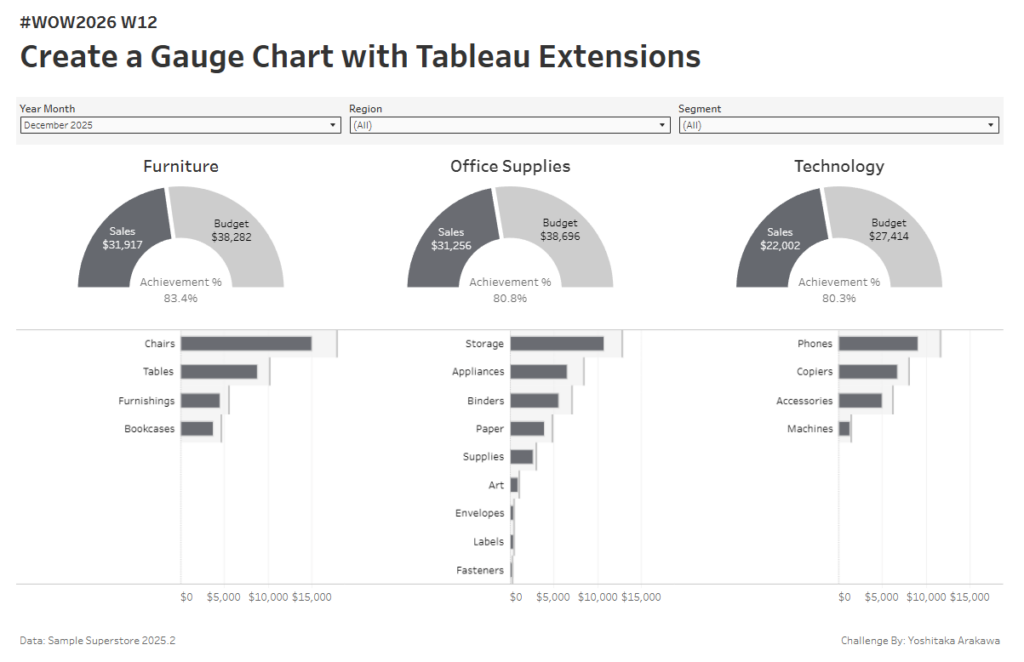
#WOW2026 | Week 12 | Create a Gauge Chart with Tableau Extensions

Introduction I was recently looking into the Radial Viz Extension after Sunburst support was added in Tableau 2025.3, and realized it can also create gauge charts with ease. Turns out this has actually been possible since the Radial Extension first launched in 2024.2! Building gauge charts in Tableau used to require map layers and dedicated

#WOW2026 | Week 12 | Create a Gauge Chart with Tableau Extensions Read More »

Tableau, Workout Wednesday