Tableau

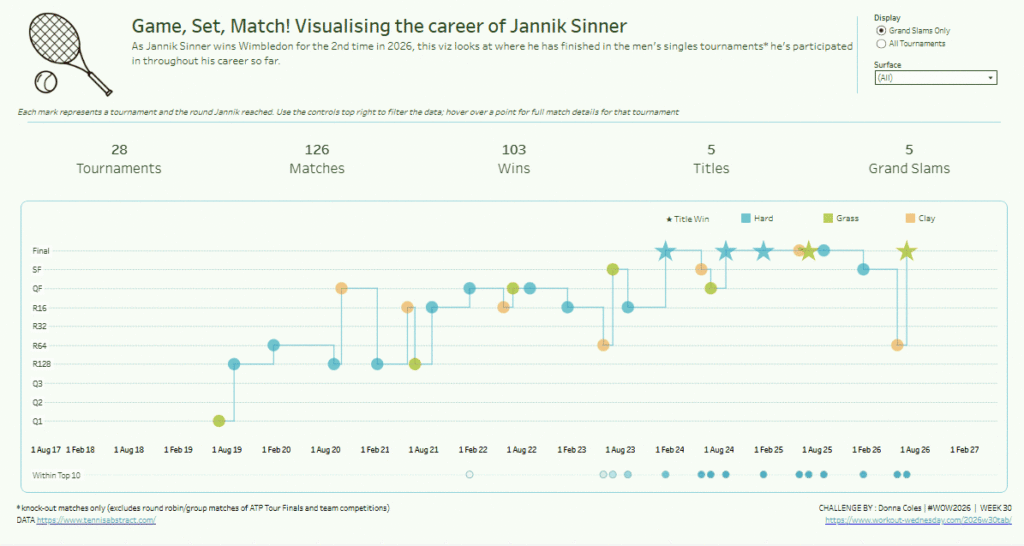
#WOW2026 | Week 30 | Can you build a ladder chart?

Introduction For this week’s challenge, I’m asking you to build a viz I put together that visualises the the tennis career of the current men’s world #1 and 2026 Wimbledon champion, Jannik Sinner. There’s a fair amount going on, so I appreciate this may take a while to completely replicate. If time is short, the […]

#WOW2026 | Week 30 | Can you build a ladder chart? Read More »

Tableau, Workout Wednesday

2026 | Week 28 | Can you build a Pareto Chart with Colored Backgrounds?

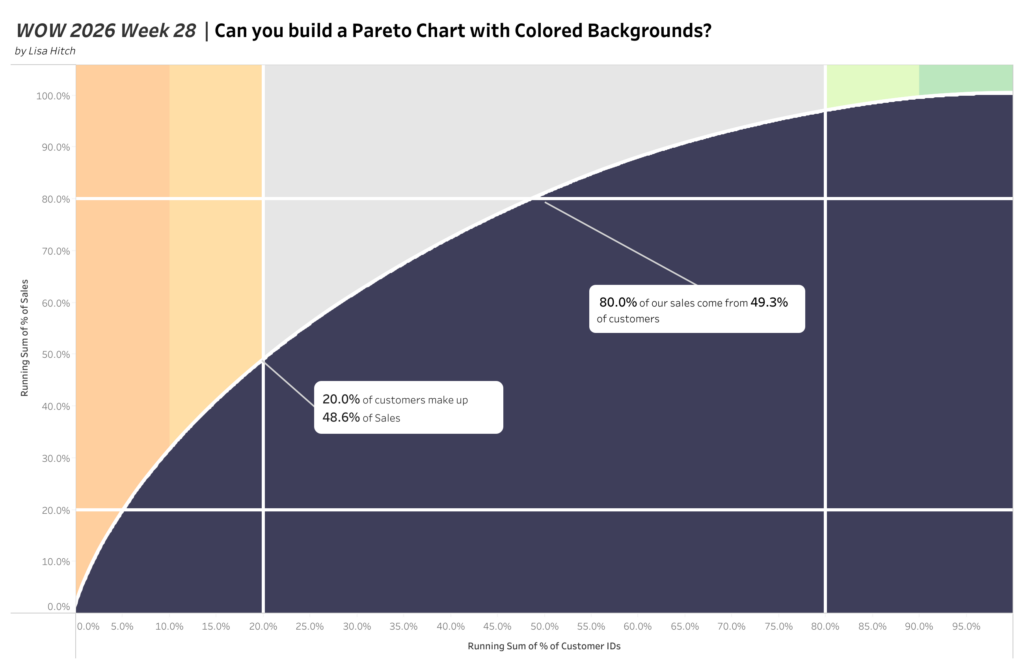
Introduction This week we have a challenge by Lisa Hitch, Coach of the New York Data School and Winner of the Tableau Conference Tips Battle.  This week we’re putting a fresh spin on a classic chart: the Pareto chart! The Pareto principle (also known as the 80/20 rule) tells us that roughly 80% of outcomes

2026 | Week 28 | Can you build a Pareto Chart with Colored Backgrounds? Read More »

Tableau, Workout Wednesday

#WOW2026 | Week 27 | Can you build a trellis chart with segment pies?

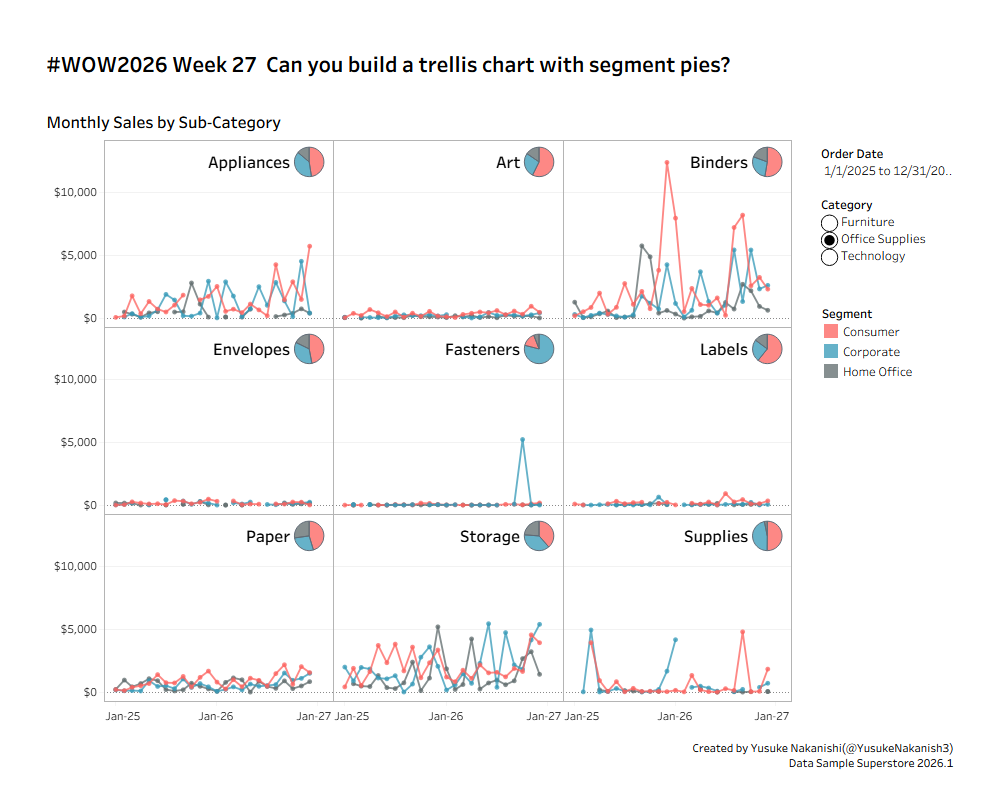
Introduction The other day, at the Hokuriku Tableau User Group, I had the opportunity to talk all about trellis charts with a room full of practitioners—covering everything from the basics and handling missing values to the aspect ratio of individual line chart panels, and more.This week’s challenge features trellis charts as its theme once again,

#WOW2026 | Week 27 | Can you build a trellis chart with segment pies? Read More »

Tableau, Workout Wednesday

#WOW2026 | Week 26 | Let’s Try the Drive Time Area

Introduction Tableau 2026.2 added a new Drive Time Area tool to maps, and I couldn’t resist building a challenge around it. You click a spot, drag outward, and Tableau shows how far you can really drive based on actual roads, not a straight line circle. This week, start from Union Station in Washington D.C. and

#WOW2026 | Week 26 | Let’s Try the Drive Time Area Read More »

Tableau, Workout Wednesday

2026 Week 25: Can you show difference from selected Sales?

Introduction This challenge is similar to other challenges, except you’re trying to think differently. Previously this challenge would have been done with LODs or Table Calcs, whilst using Parameter Actions. But you don’t need those fancy Table Calcs or LODs to make the basis of this to work.Yes this does contain some hacky elements, mainly

2026 Week 25: Can you show difference from selected Sales? Read More »

Tableau, Workout Wednesday

#WOW2026 | Week 24 | Can you measure and visualize travel distance?

Introduction The World Cup is in North America this month, and I saw a post showing the locations of national team training sites along with venues where games are being held, and the distance they were each travelling. I was curious if I could build something similar, and I was similarly curious how much each

#WOW2026 | Week 24 | Can you measure and visualize travel distance? Read More »

Tableau, Workout Wednesday

#WOW2026 | Week 23 | Can you create a double-sided multi-row Stem-and-Leaf Plot?

Introduction When browsing around for inspiration for this week’s challenge, I came across this stem & leaf Power BI WOW challenge by Meagan Longoria, which in turn was inspired by a Tableau #WOW challenge set by Yusuke in 2024. So I thought it would be fun to go ‘full circle’ and see if I could

#WOW2026 | Week 23 | Can you create a double-sided multi-row Stem-and-Leaf Plot? Read More »

Tableau, Workout Wednesday

#WOW2026 | 23 | Fun with Gantt Charts

Introduction For the week’s challenge we’re looking at Gantt charts! Gantt chart don’t have to necessarily show timeline data. In Tableau, they can be used to show “floating” bar charts. Which can be very powerful in certain use cases. This challenge looks at historical American Football Super Bowl betting odds and game results. In this

#WOW2026 | 23 | Fun with Gantt Charts Read More »

Tableau, Workout Wednesday
#WOW2026 W21: Can you map out the D3 athletic conferences?

Introduction This weeks challenge comes from a Data School Consultant  – Jacob Aronson  This week’s challenge puts the spotlight on some of America’s lesser known colleges and universities – those that compete at the D3 athletic level (including my Alma Mater, Carleton College).The 400 schools are organized into ~44 conferences so that teams that are

#WOW2026 W21: Can you map out the D3 athletic conferences? Read More »

Tableau, Workout Wednesday