#WOW2024 Week 44 | Can you join two spatial files to find intersection?
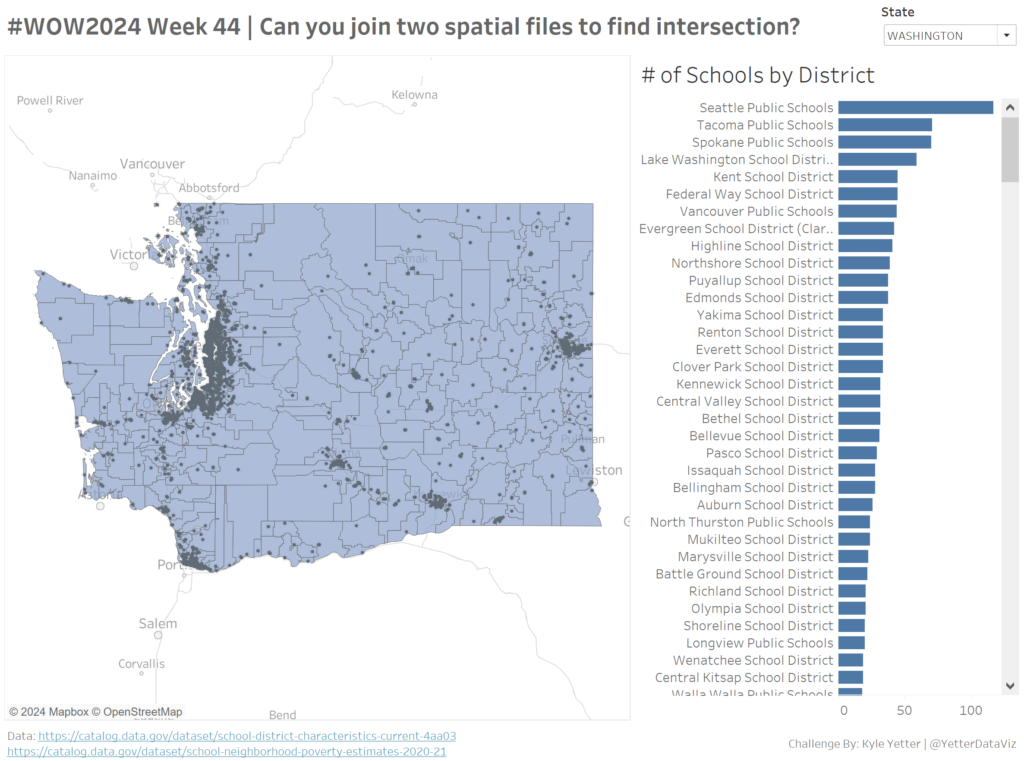
Introduction This week we’re working with some spatial data. I have a project at work where we’re finding the number of records (points) that are within a geospatial area (polygon), so we’ll try that this week. We’ll use public school district boundaries (polygons) and school locations (points) to find the number of schools in each […]
#WOW2024 Week 44 | Can you join two spatial files to find intersection? Read More »
Tableau, Workout Wednesday