Workout Wednesday

2026 Week 10 | Power BI: Dynamic visibility of visuals

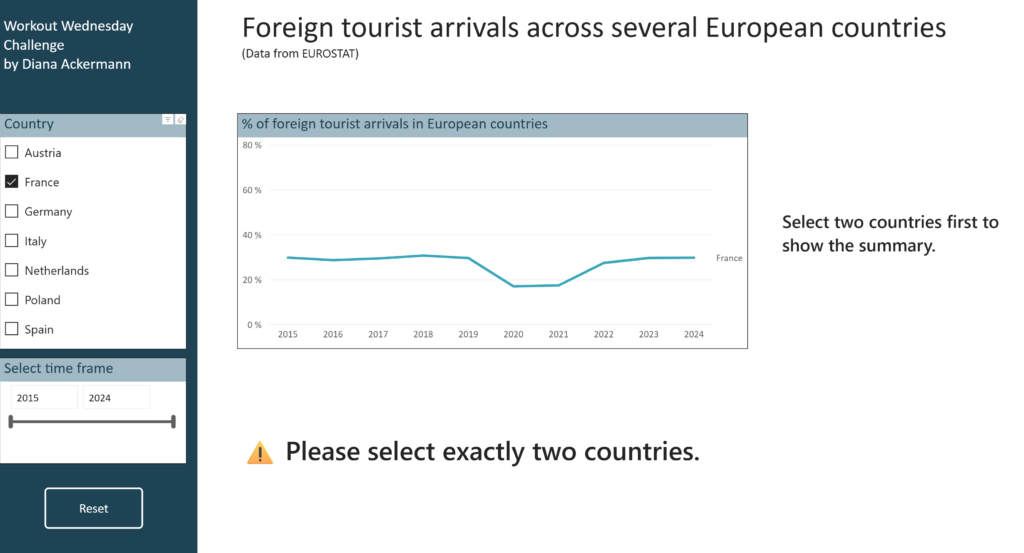
Introduction This challenge focuses on a powerful Power BI technique: conditional visibility using overlapping visuals and dynamic transparency. Instead of hiding visuals entirely, you’ll learn to control visibility through background color transparency – making elements appear and disappear based on user selections. Based on the selection of countries, we are looking at differences in foreign […]

2026 Week 10 | Power BI: Dynamic visibility of visuals Read More »

#WOW2026 | Week 9 | Can you build a parallel coordinates chart?

Introduction This week we’re going to build out a parallel coordinates chart – a type of visualisation used to display and compare multiple numerical measures.  My daughter, Mia, is an academy level footballer and wears a stats vest in matches and training to capture lots of data about her performance. I’d been meaning to try

#WOW2026 | Week 9 | Can you build a parallel coordinates chart? Read More »

2026 Week 07 | Sigma: Building a Custom Plugin with AI

Introduction This week’s Workout Wednesday challenge was Numbers of Different Magnitudes, but the bigger lesson for me was this: You can build custom analytical experiences in Sigma using AI. For this submission, I used AI-assisted coding to create a custom Sigma plugin (React + D3) that goes beyond standard chart behavior. It combines a magnitude view

2026 Week 07 | Sigma: Building a Custom Plugin with AI Read More »

#WOW2026 | Week 7 | Exploring Table Calcs vs LODs

Introduction Hello everyone, I’m very happy to be back for another year of Workout Wednesday! For my first challenge, I wanted to focus on something that every Tableau learner will encouter: Table Calculations and Level of Detail (LOD) Calculations, and what is the difference between them? Well, sometimes only one of these types of calculations

#WOW2026 | Week 7 | Exploring Table Calcs vs LODs Read More »