Introduction
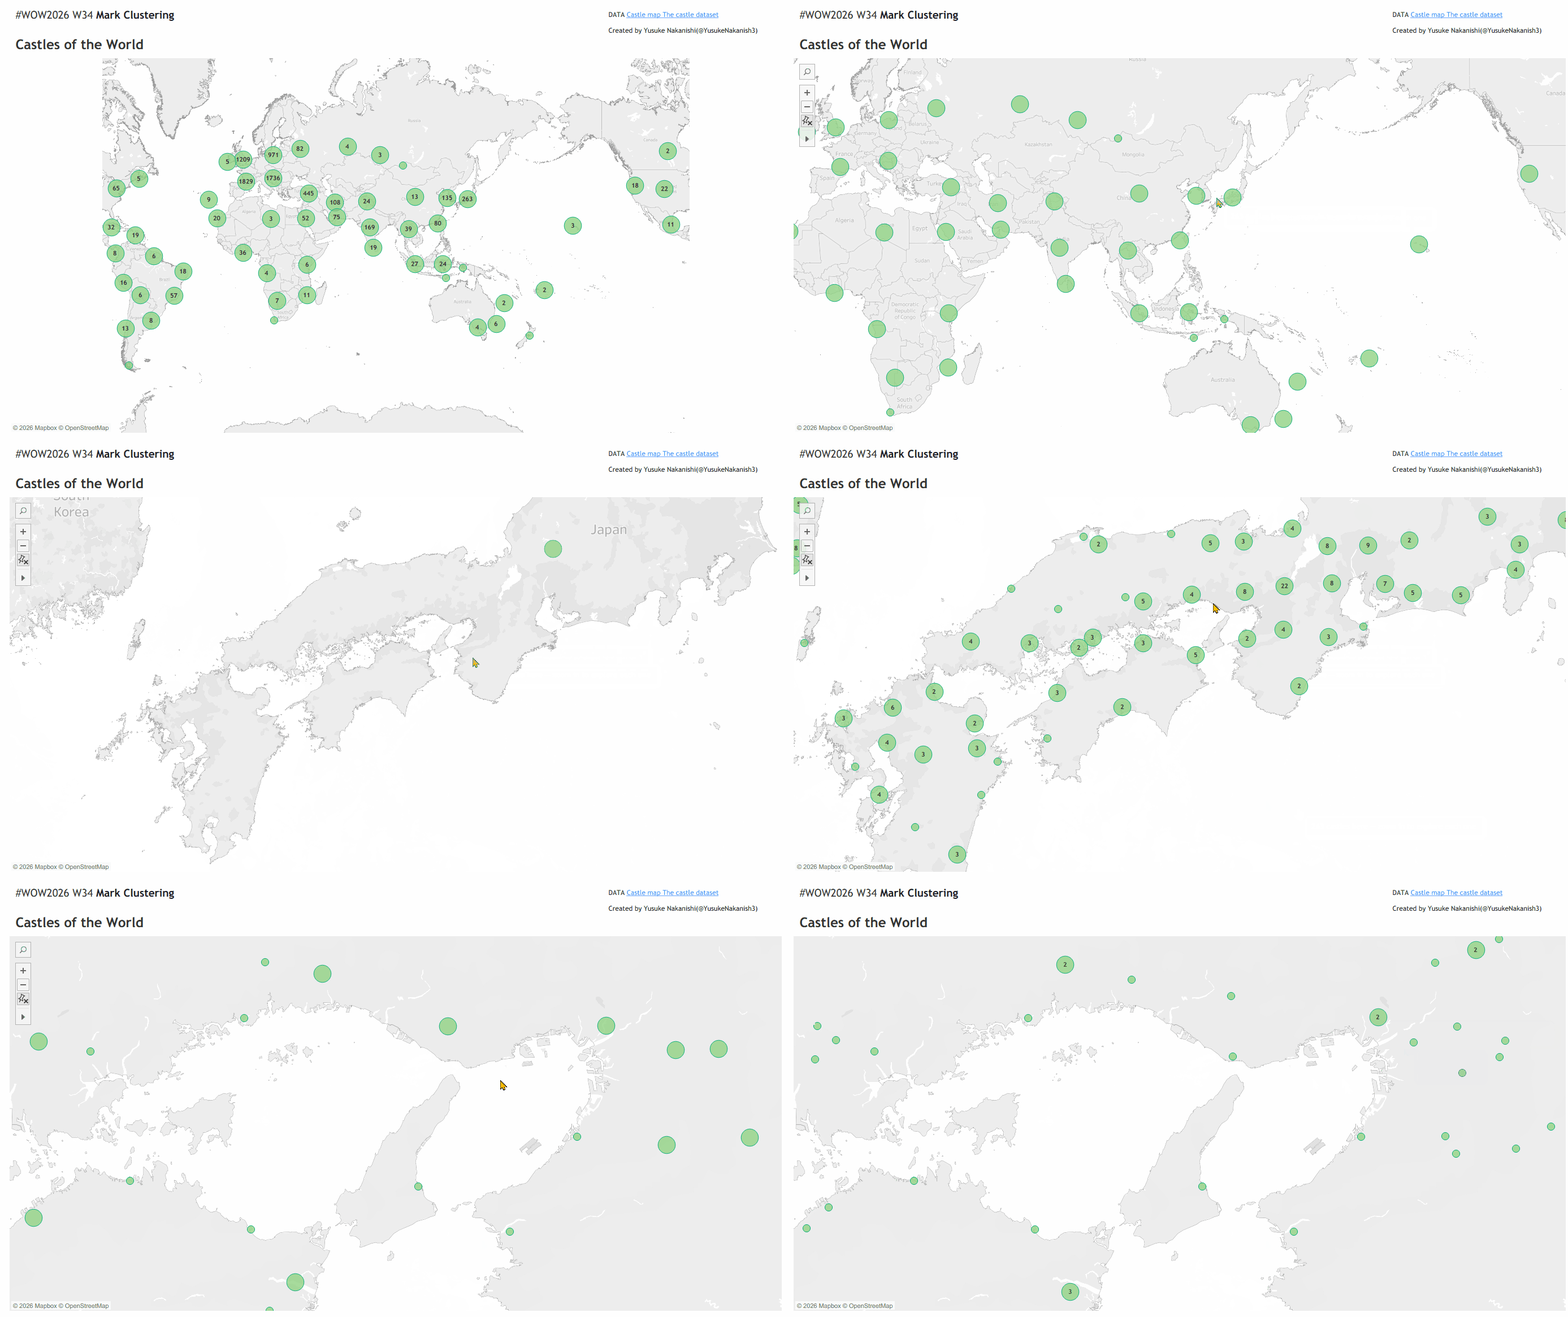
This week is all about maps. Tableau has always been strong with maps, but this time we’ll push it further using Dynamic Spatial Parameters, added back in 2025.2, to build something a little cooler.
It’s a technique that’ll come in handy for real-world work too, so have fun with it and give it a go!
Requirements
- Dashboard size: 1366 × 768
- Number of sheets: 1
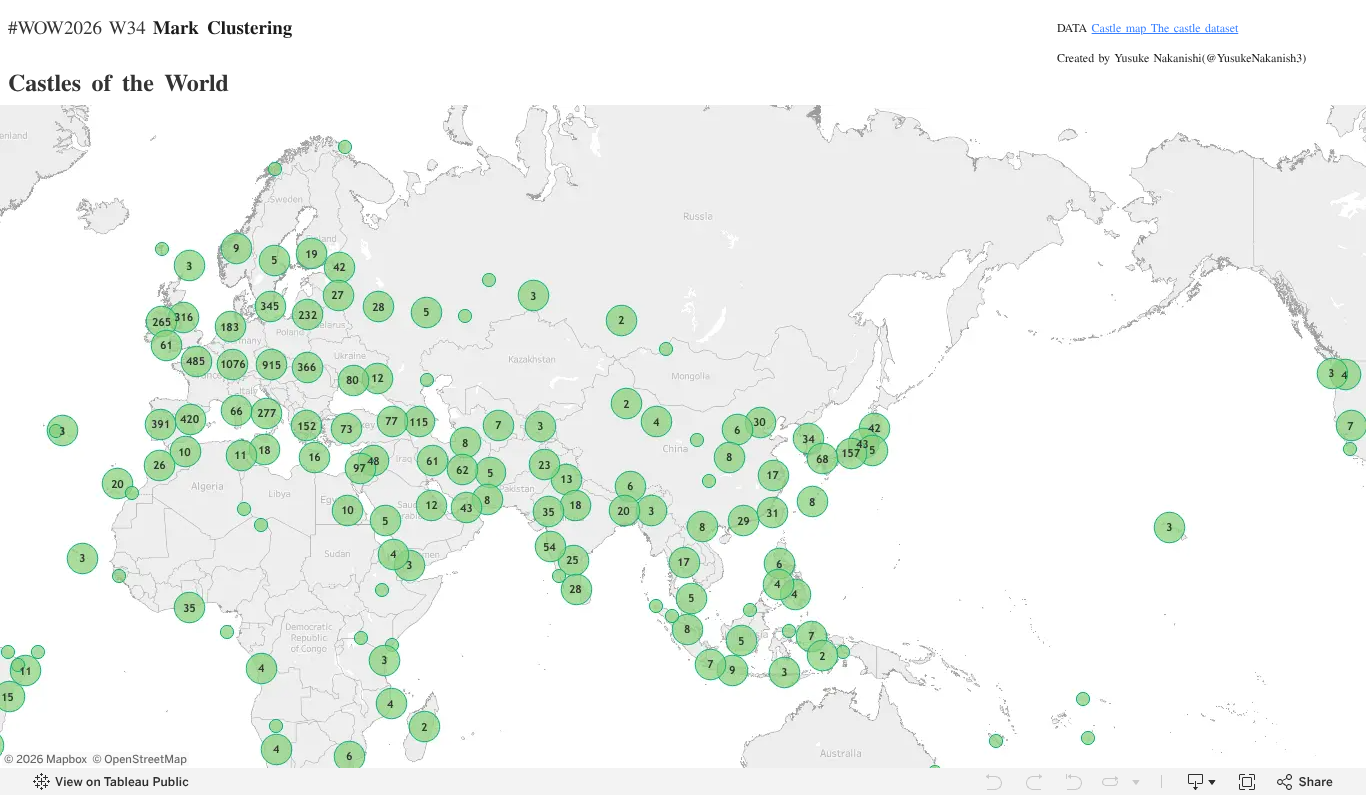
- Plot each Castle (Qid) as a point on the map
- Cluster the marks according to the Zoom Level parameter
- Show a different tooltip for single-location marks and for clustered marks
- Your clustering doesn’t have to match mine exactly
- Colors and fonts are up to you
Note: This version uses a Zoom Level parameter to drive the clustering, so it runs smoothly in any environment. If you’d like to experience the original idea — where the clustering responds as you zoom the map in and out — please build it in Tableau 2026.1. On 2026.2 it freezes up.
Dataset
For this challenge, we will use the Castle dataset from the Castle map.
Attribute
When you publish your solution on Tableau Public make sure to take the time and include a link to the original inspiration. Also include the hashtag #WOW2026 in your description to make it searchable!
Share
After you finish your workout, share on X and/or LinkedIn using the hashtag #WOW2026 #Tableau and tag @WorkoutWednsday. Also, come join us in the Workout Wednesday channel on the Tableau Community Slack!