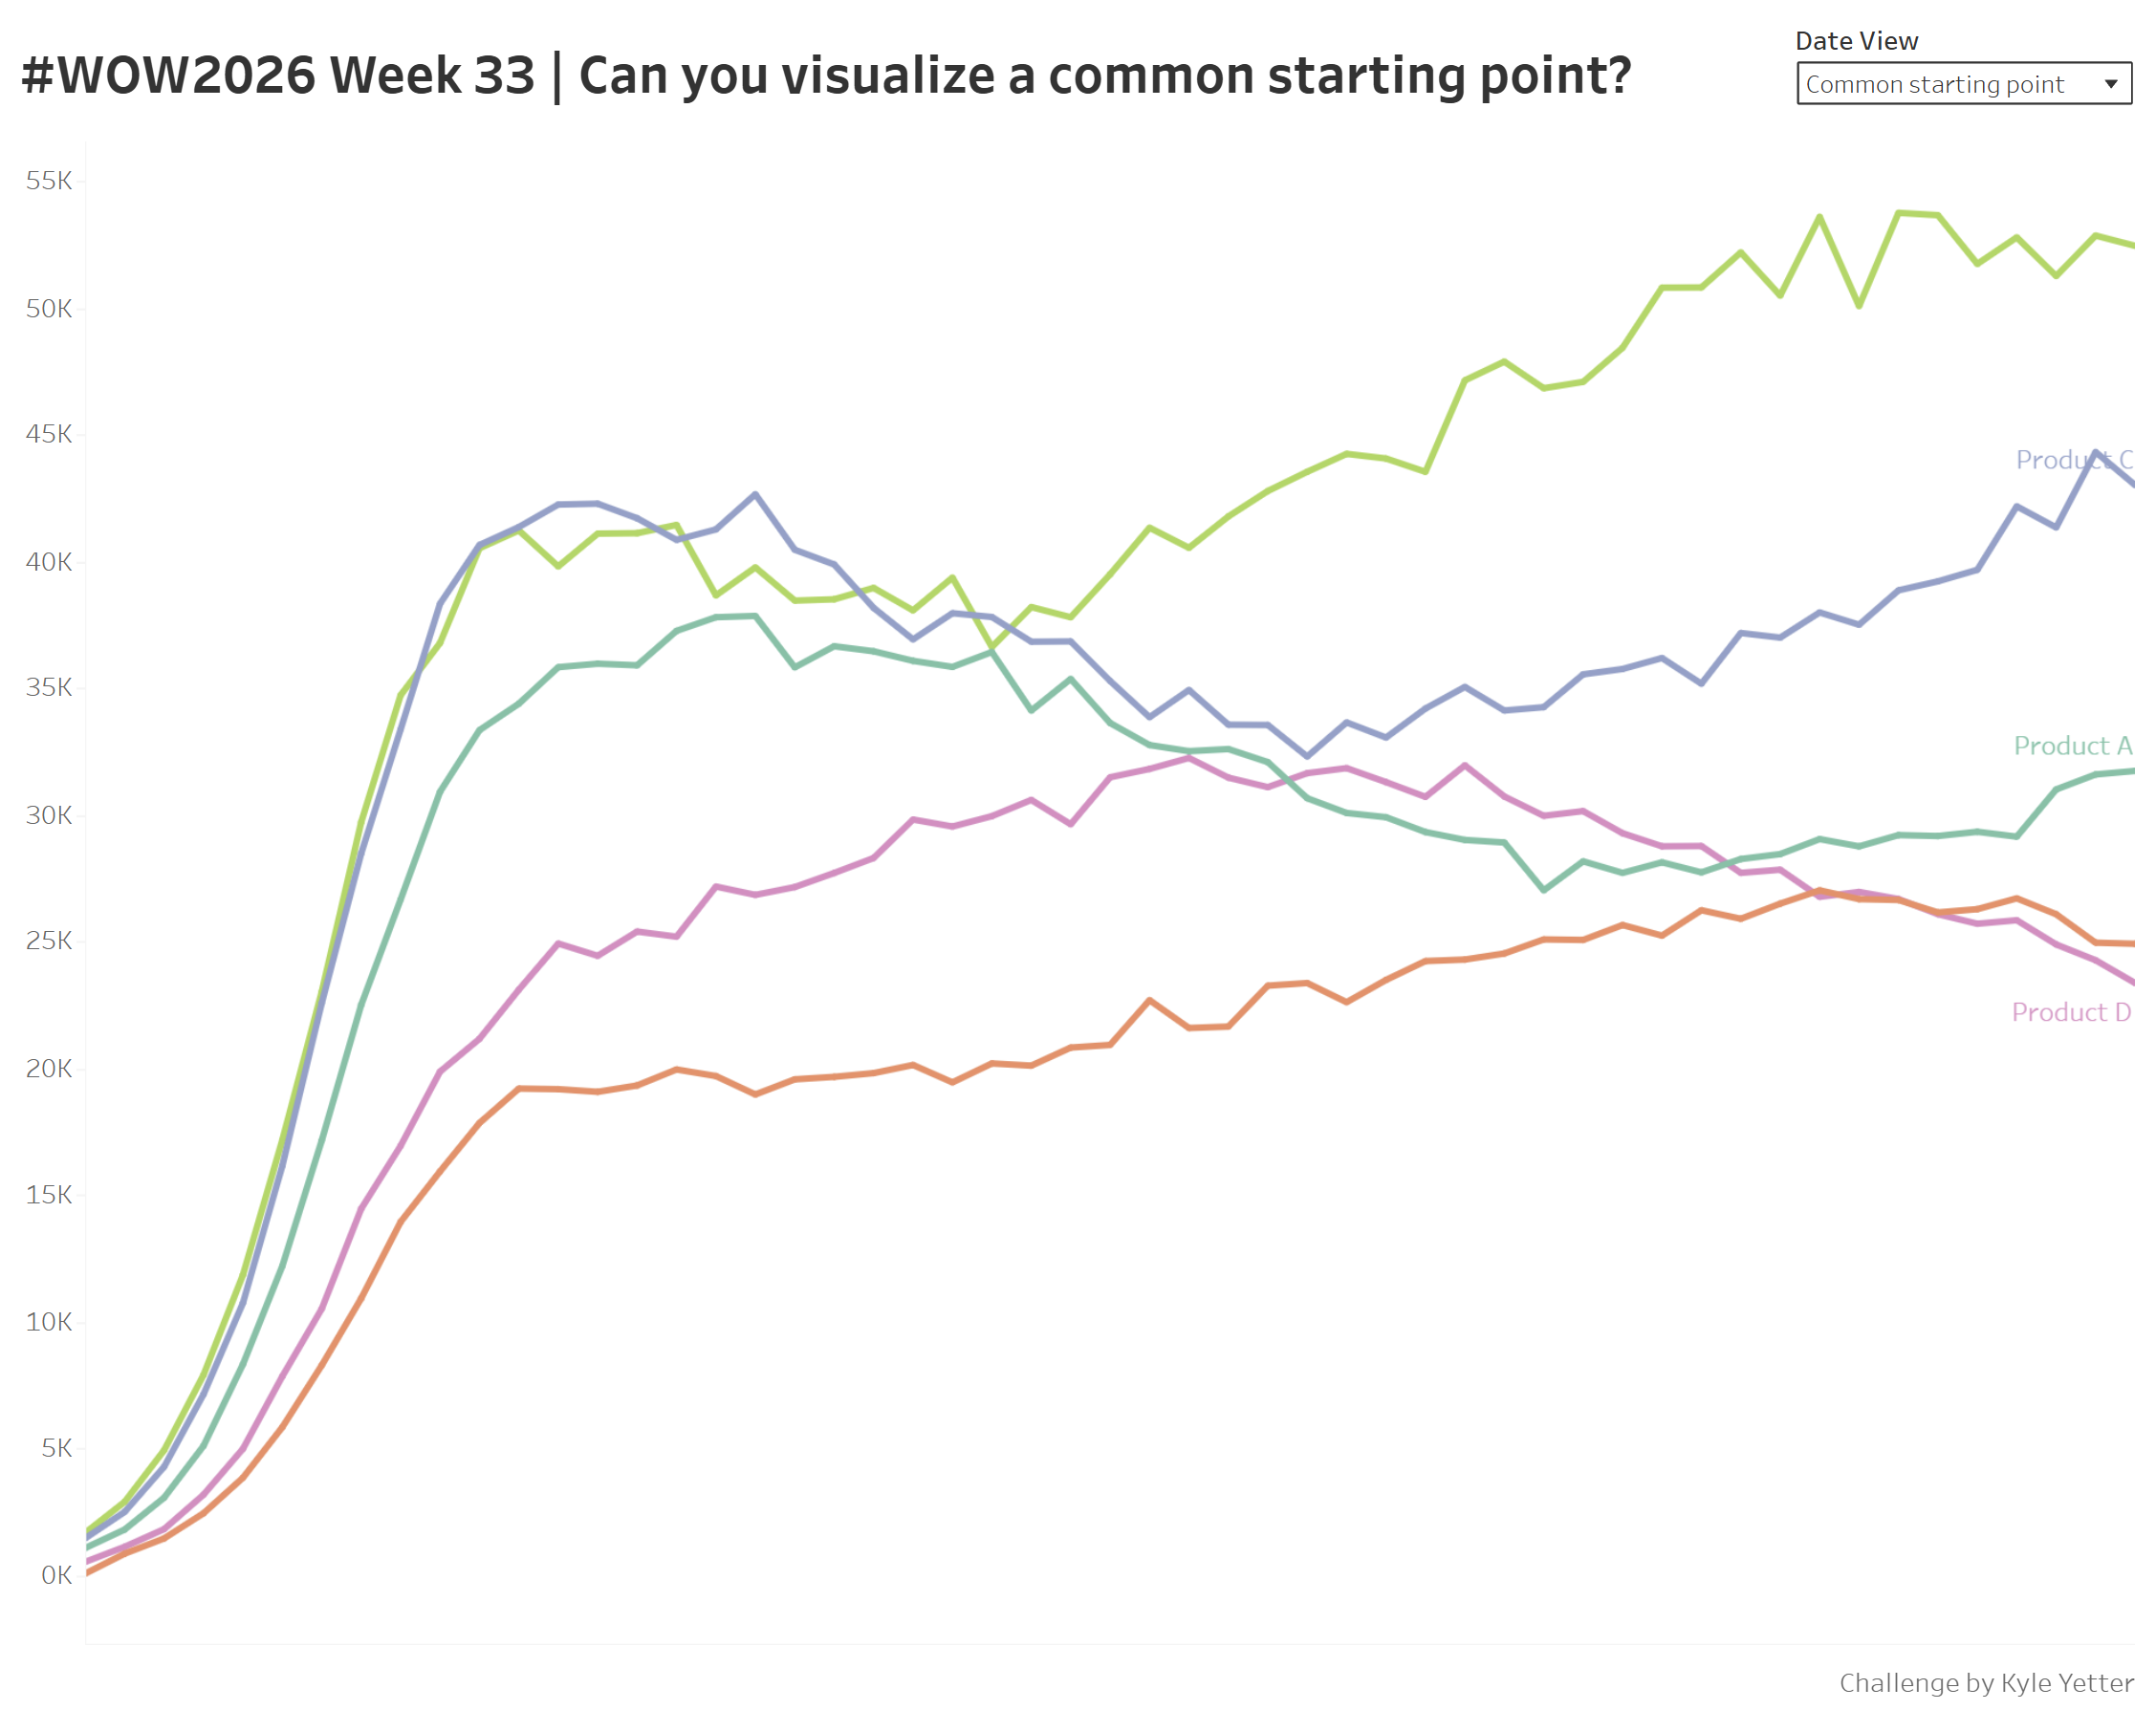
Sometimes you’ll have products that launch at different times, and so questions come up of how is this most recent launch comparing to other launches in the past? So this week, we’ll have a view of the past year for 5 different products, and then a view with all of those products from a common starting point when they were launched. Enjoy!
When you publish your solution on Tableau Public make sure to take the time and include a link to the original inspiration. Also include the hashtag #WOW2026 in your description to make it searchable!