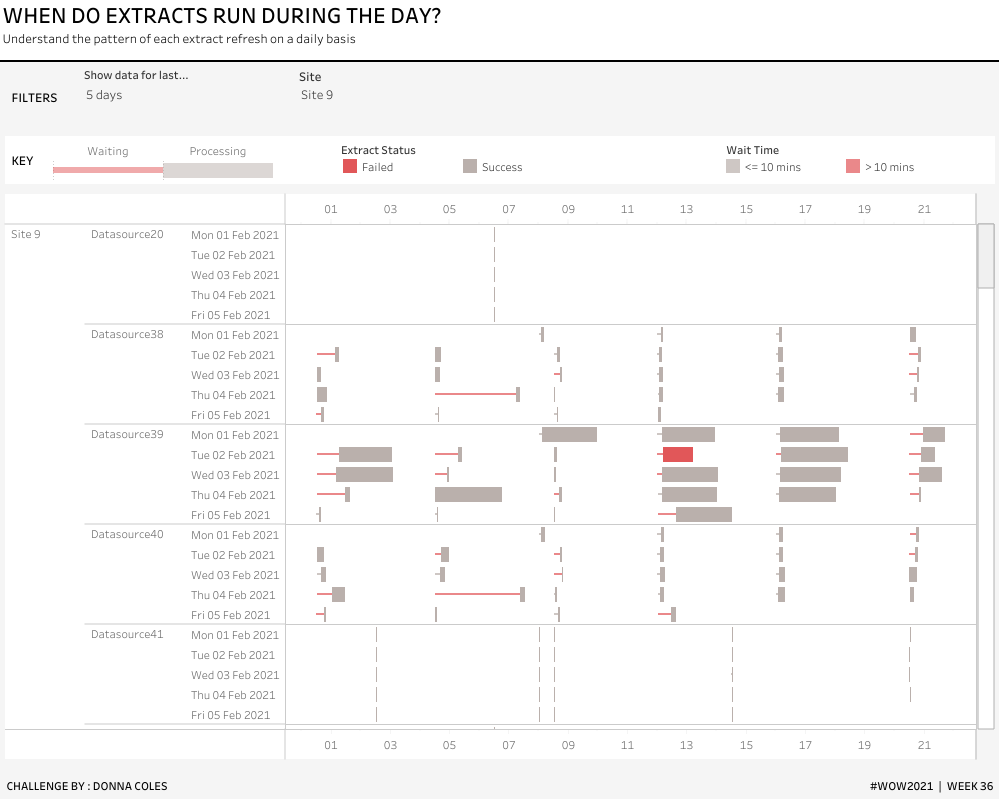
Author name: Lorna Brown

2021 Week 33 | Tableau: Can you create a moving average chart with a focus on selected subcategories?

Introduction After the results of the community survey, the top ranked feature was Table Calculations, so guess what? Let’s do some Table Calculations! Click to open in Tableau Public Requirements Dashboard 600 x 600 ONE SHEET Table Calcs ONLY! Create a parameter controlled moving average by month for sales. Create a way to multi-select subcategories […]

2021 Week 33 | Tableau: Can you create a moving average chart with a focus on selected subcategories? Read More »

2021 Week 20 | Tableau: Can you compare Same Day to a Selected Date?

Introduction I came across an interesting challenge. When comparing data, Tableau automatically compares to the same date on the prior month/year etc. But what if you want to compare to the same DAY. For example, Tuesday 18th May 2021, would compare to Tuesday 19th May 2020 for the previous year, and Tuesday 20th April for

2021 Week 20 | Tableau: Can you compare Same Day to a Selected Date? Read More »

2021 Week 16 | Tableau : Can you use Quick LODs to recreate this view?

Introduction With Tableau 2021.1 being released last month, I thought it was time for a challenge. This week we focus in on the new feature of Quick LODs.  Click to open in Tableau Public Requirements Dashboard Size: 800px by 700 px One Sheet Create a dual axis chart which shows the Sub-Category Average Sales by

2021 Week 16 | Tableau : Can you use Quick LODs to recreate this view? Read More »

2020 Week 7 | Tableau : Can you use Dashboard Extensions?

Introduction Features and functionality on using Tableau and Tableau Public are ever growing. I believe we as WOW have never done this particular object before. Did you know that Tableau has an Extension Gallery? But also did you know that some of the extensions work on Tableau Public?  I never thought about using Extensions on

2020 Week 7 | Tableau : Can you use Dashboard Extensions? Read More »