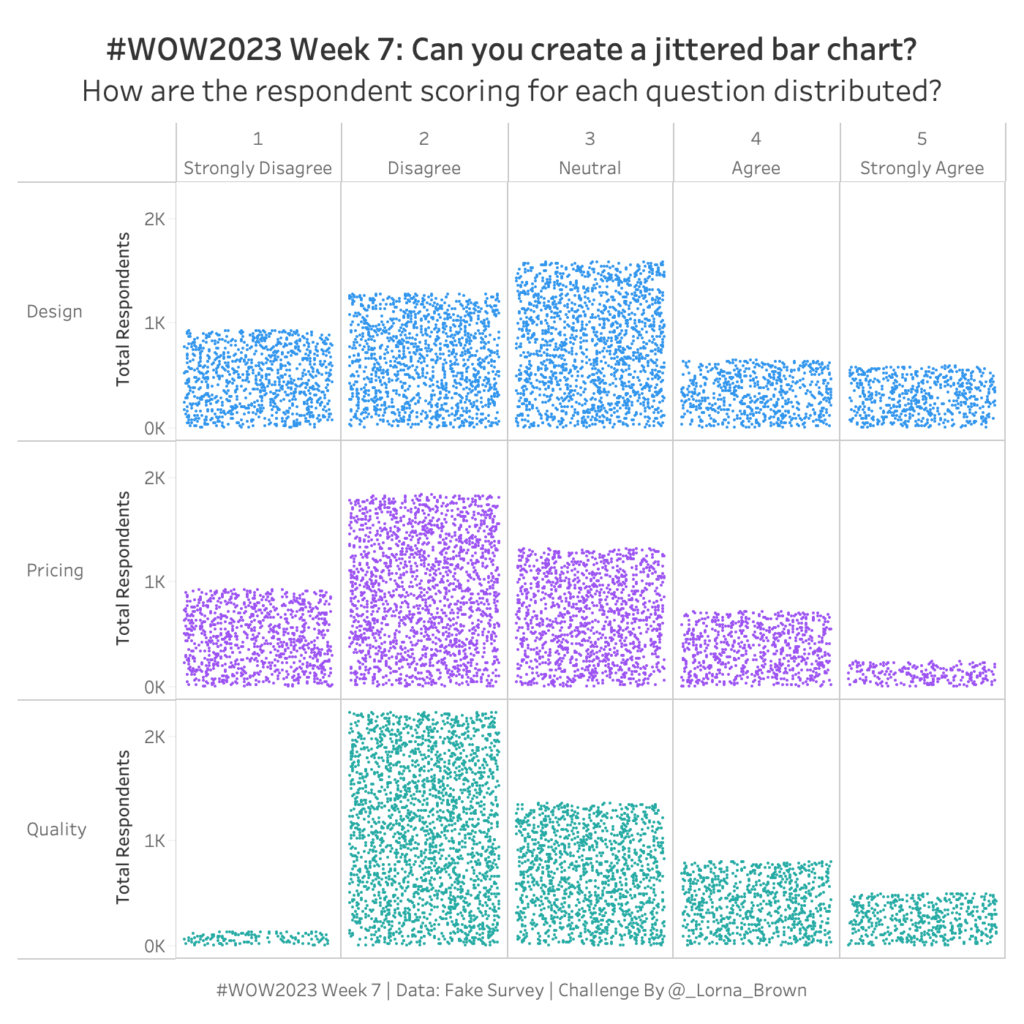
Author name: Lorna Brown

#WOW2022 W38: Can you create a Waterfall Pipeline using Salesforce Data?

Introduction This week is Dreamforce; Salesforce’s conference. So I thought I would stay on theme and use Salesforce Data. When I first started to see Salesforce pre-built dashboards they included several elements, but the one we are going to focus on today is the Waterfall chart. This allows us to see how much value is […]

#WOW2022 W38: Can you create a Waterfall Pipeline using Salesforce Data? Read More »

#WOW2022 W33: Can you compare the latest month to the prior X months average?

Introduction When looking through the challenge insights I realised we haven’t had many of the fundamental LOD style Workouts for a while. So this week we take a look at how does the latest month compare to the prior X months average? Click to open in Tableau Public Requirements Dashboard Size: 800 x 700px 2

#WOW2022 W33: Can you compare the latest month to the prior X months average? Read More »

#WOW2022 | Week 03 | Can you visualise percent difference from a selected date?

Introduction I can’t believe I am entering my 4th year as a Workout Wednesday coach. It has been such an incredible journey so far. I bet you think how do we come up with the challenges all the time? Tableau has such a broad range of calculations and different ways of doing things so that

#WOW2022 | Week 03 | Can you visualise percent difference from a selected date? Read More »

#WOW2021 Week 46 | Tableau | Can you recreate this difference chart?

Introduction This week I wanted to try a different chart type which is using several elements and some tips & tricks from our Speed Tipping session from TC21.  I also love this chart in how it highlights the difference between the two values. Click to open in Tableau Public Requirements Dashboard Size: 800 x 400

#WOW2021 Week 46 | Tableau | Can you recreate this difference chart? Read More »