2021 Week 33 | Tableau: Can you create a moving average chart with a focus on selected subcategories?

Introduction

After the results of the community survey, the top ranked feature was Table Calculations, so guess what? Let’s do some Table Calculations!

Requirements

  • Dashboard 600 x 600
  • ONE SHEET
  • Table Calcs ONLY!
  • Create a parameter controlled moving average by month for sales.
  • Create a way to multi-select subcategories to bring them into focus, grey out others.
  • Shade the background a light grey.

Colour Palette: Hue

Misc: Art, Envelops, Fasteners, Labels & Supplies.

Dataset

This week uses the superstore dataset for Tableau 2021.1. You can get it here at data.world

Attribute

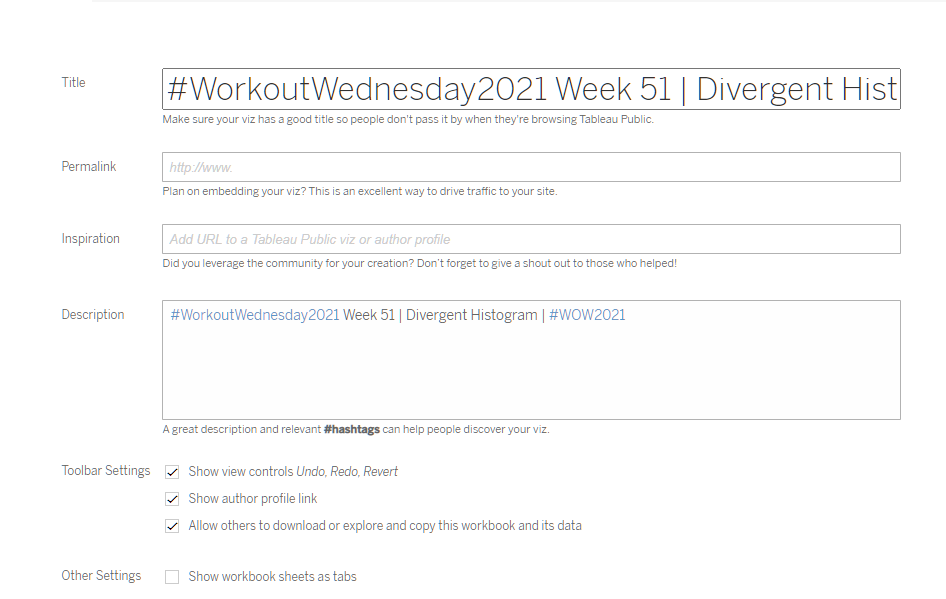
When you publish your solution on Tableau Public make sure to take the time and include a link to the original inspiration.  Also include the hashtag #WOW2021 in your description to make it searchable!

Share

After you finish your workout, share on Twitter using the hashtag #WOW2021 and tag @AnnUJackson, @ItsCandraM, @LukeStanke, @_Lorna_Brown and @HipsterVizNinja

Solution

Interactive