Introduction
This year we’ve made a commitment to start with the basics and build, so this challenge is designed to do just that.
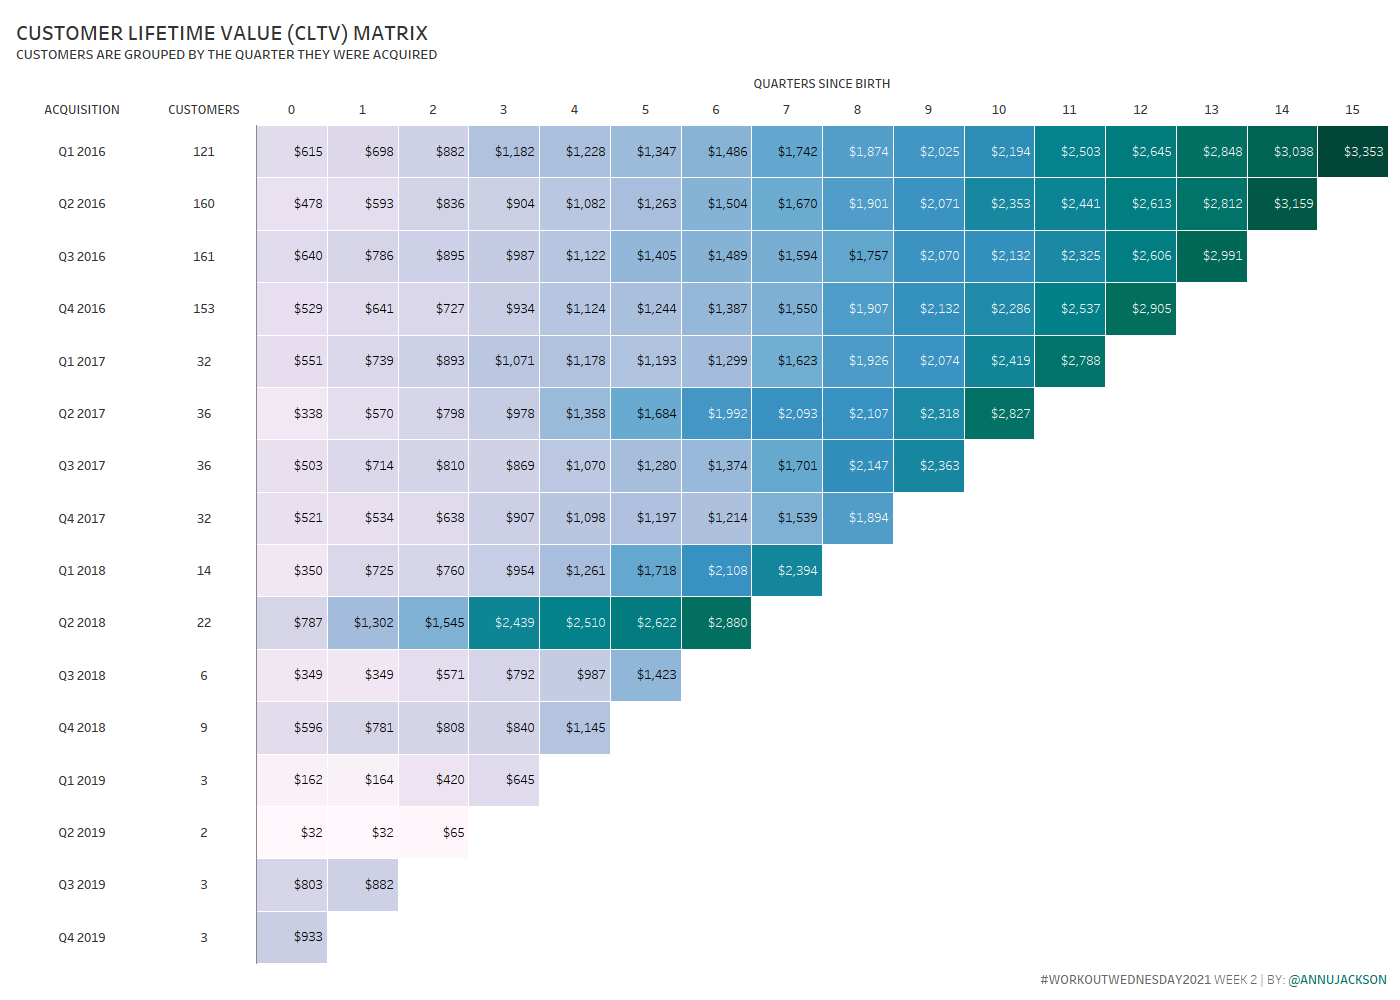
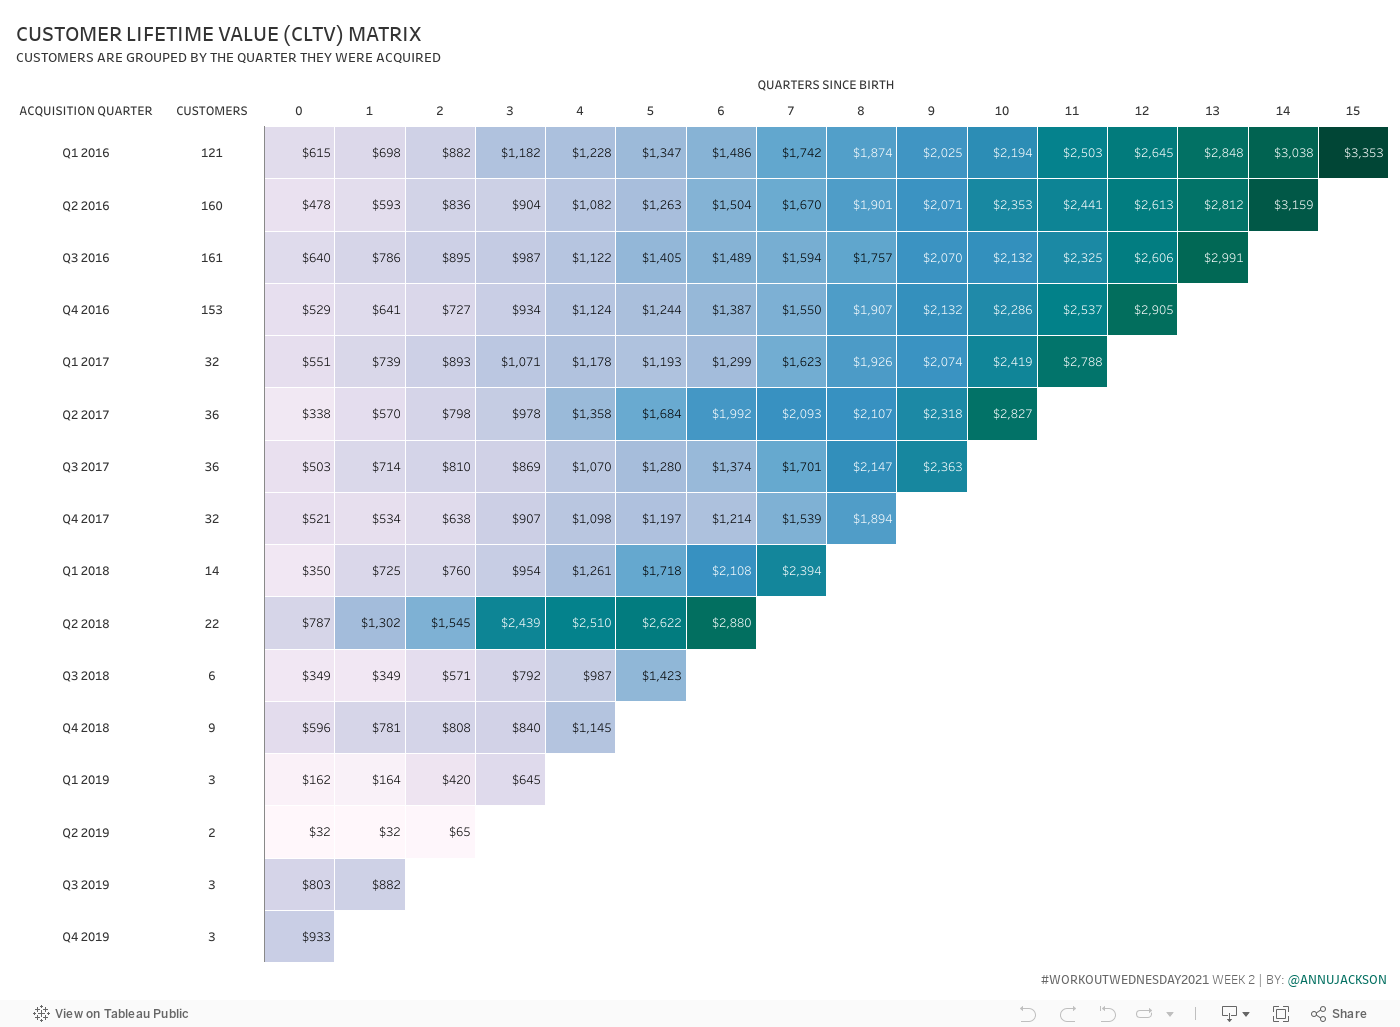
This week, you’ll be constructing a Customer Lifetime Value Matrix (CLTV). This viz is frequently used in marketing and retail industries to understand the value of each customer. Specifically, the interesting insights come when you scan vertically and see that your initiatives are paying off and customers of the same relative age are spending more money.
I’ll admit the Superstore data is a little sparse, so I added some extra calculations to fill in matrix gaps. So that said, you are free to build the initial matrix and have gaps OR you can do extra credit and fill in those gaps.
Requirements
- Dashboard Size: 1400px by 1000 px
- # of Sheets – up to you
- Create a Customer Lifetime Value Matrix
- Each customer is categorized by their acquisition quarter (first quarter of purchase)
- Calculate the Average Lifetime Value of the Customer for # of Quarters since birth (defined as total sales/total customers)
- Match tooltips and formatting
- Color legend is Color Brewer Purple/Blue/Green available here
- Make sure that there is a white background for any marks with no CLV showing
- Advanced/Extra Credit
- Fill in the gaps for both Q2 2019, and Q3 2018
Dataset
This week uses the superstore dataset for Tableau 2019.4. You can get it here at data.world
This data set ends on 12/31/2019, so you’re free to use a different version if available.
Attribute
When you publish your solution on Tableau Public make sure to take the time and include a link to the original inspiration. Also include the hashtag #WOW2021 in your description to make it searchable!
Share
After you finish your workout, share on Twitter using the hashtag #WOW2021 and tag @AnnUJackson, @ItsCandraM, @LukeStanke, @_Lorna_Brown and @HipsterVizNinja
Solution
Interactive
Can you please clarify on what is no. of quarters since birth?
This would be the number of quarters (based on order date) from their original acquisition quarter (EG: order date – acquisition quarter)
Just want to say thank you very much for your consistent efforts and initiatives. It means so much for beginners like me. THANK YOU.
Hi Ann,
I was able to recreate your solution pretty well. That’s the good news, and I certainly appreciate your sharing you knowledge to help newbies like me!
I initially had some trouble with the color palette, but I think I got that sorted out (there are a number of different Color Brewer PbBuGn palettes, and I wound up guessing which one to use).
Something very strange happened when I moved on toward the extra credit section. I (thought I) duplicated your CLTV calculation but, when I applied it to my viz, the averages seemed to disappear and were replaced by totals. I realized that I probably made some sort of error in entering the formula, so I downloaded your solution and copied your calculation. That one worked fine. The thing that is strange is that I did a character by character comparison of the two calculations, including copying both into Word documents and comparing the files. Word says the files are identical, and my manual review didn’t turn up any differences. I’m sure I missed something, but it is certainly driving me nuts. Guess it shows how much I have to learn.
Anyway, thanks for sharing. I’m hoping some time soon I will be able to create my own solutions to the challenges and not have to rely on reproducing someone else’s work.
Ciao!
Tom
Hello
On suggestion, instead of second version CLTV, we can also use this one:
I compared, as I see no difference with the proposed one.
ifnull([CLVT-basic], LOOKUP([CLVT-basic],-1))