2022

Power BI page featuring an image carousel

2022 Week 52 | Power BI: Image Carousel

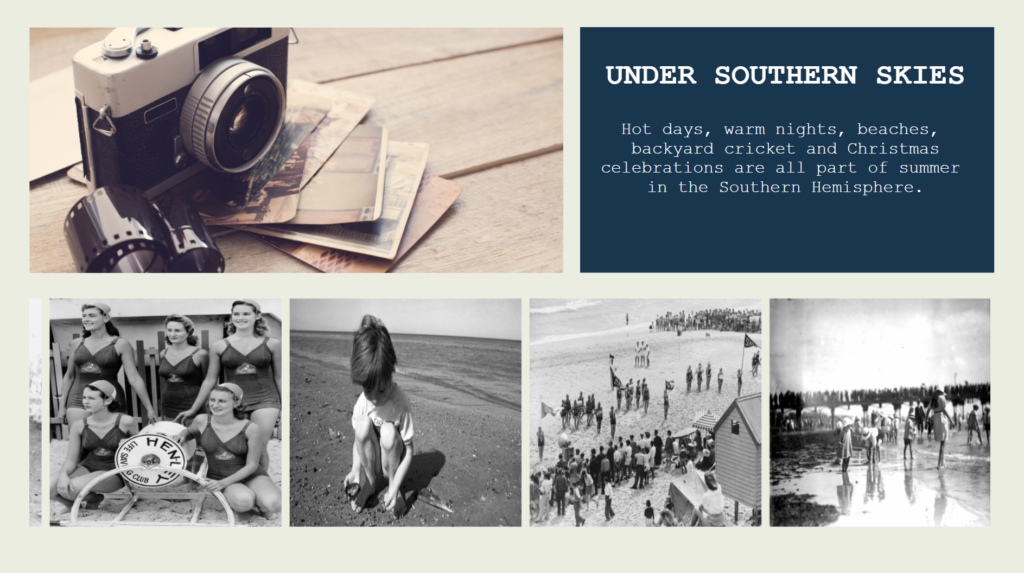
Introduction “Hot days, warm nights, beaches, backyard cricket and Christmas celebrations are all part of summer in the Southern Hemisphere.” This week we will be connecting to a public flickr photo gallery from the State Library of South Australia, to create an image carousel using a custom visual from AppSource. Requirements Power Query Connect to the

2022 Week 52 | Power BI: Image Carousel Read More »

Power BI, Workout Wednesday

#WOW2022 Week 51: Let’s show quarterly sales with end-user flexibility

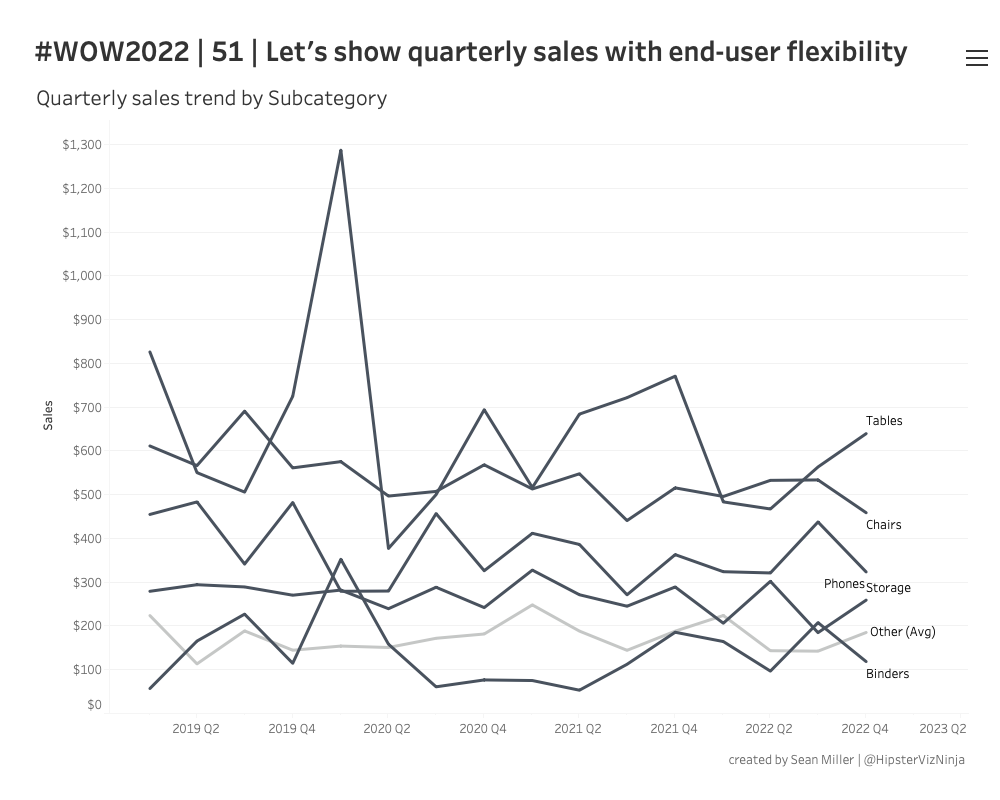
Introduction I recently had this type of request at work – stop me if you’ve heard this before. We need to show the trend of [single or multiple measures] and we want to see it by these specific dimensions. Oh! And we also need to be able to filter by the same dimensions as well…

#WOW2022 Week 51: Let’s show quarterly sales with end-user flexibility Read More »

Tableau, Workout Wednesday

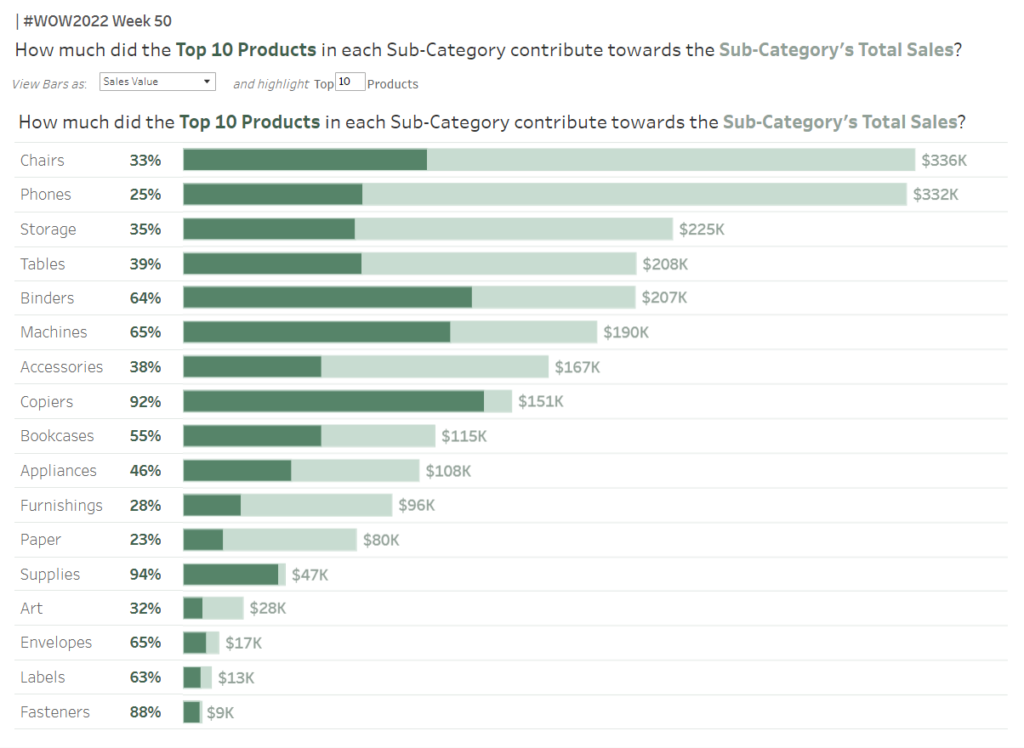
#WOW2022 | Week 50 | Interactive Proportional Brushing

Introduction This is my last challenge of the year and what better way to round things off than with everyone’s favourite chart – the bar chart – but let’s make it “sexy”. Bar charts may be simple but when you combine them with some interactive highlighting and sorting you can create something quite dynamic which

#WOW2022 | Week 50 | Interactive Proportional Brushing Read More »

community, Tableau