Visualization

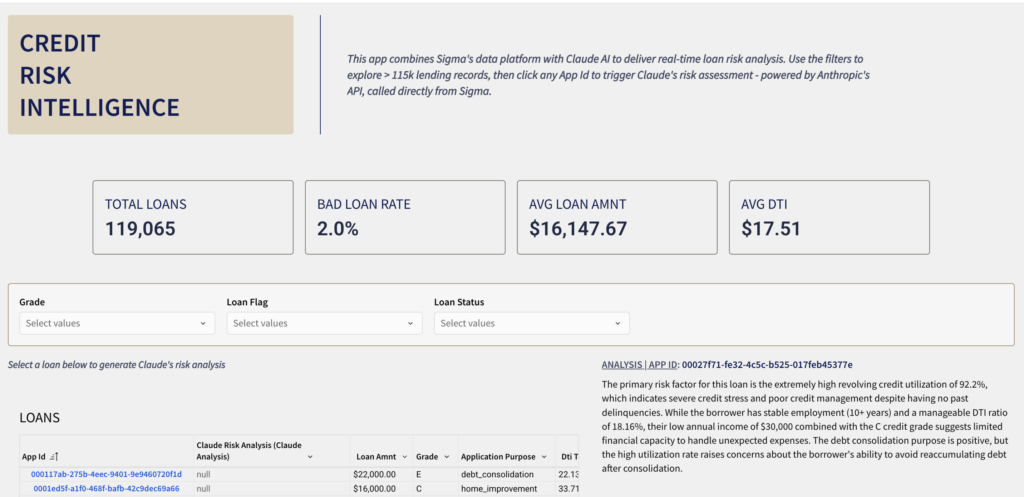
2026 Week 19 | Sigma: AI Credit Risk Analysis

Introduction This week’s challenge explores something entirely new for Sigma – calling an external AI API directly from a workbook action. Using Sigma’s API Connector and Action Sequences, you’ll build a Credit Risk Intelligence app that sends live loan data to Claude’s AI and displays a real-time risk explanation – all without leaving Sigma. Need Access […]

2026 Week 19 | Sigma: AI Credit Risk Analysis Read More »

Sigma, Workout Wednesday

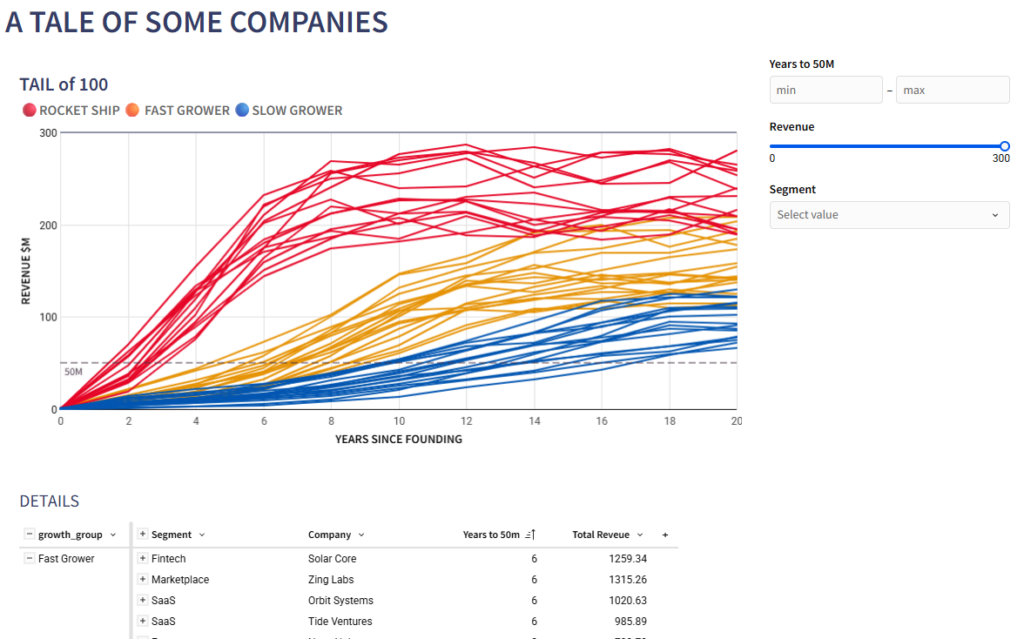
2026 Week 07 | Sigma: Tale No One

Introduction This week’s challenge: recreate a Tale visualization with a twist. The goal is to show revenue growth over time for 100 companies, grouped into: • Rocket Ships• Fast Growers• Slow Burners The catch? Sigma doesn’t separate “line identity” and “color grouping” the way most tools do. So the real challenge isn’t the chart. It’s

2026 Week 07 | Sigma: Tale No One Read More »

Sigma, Workout Wednesday

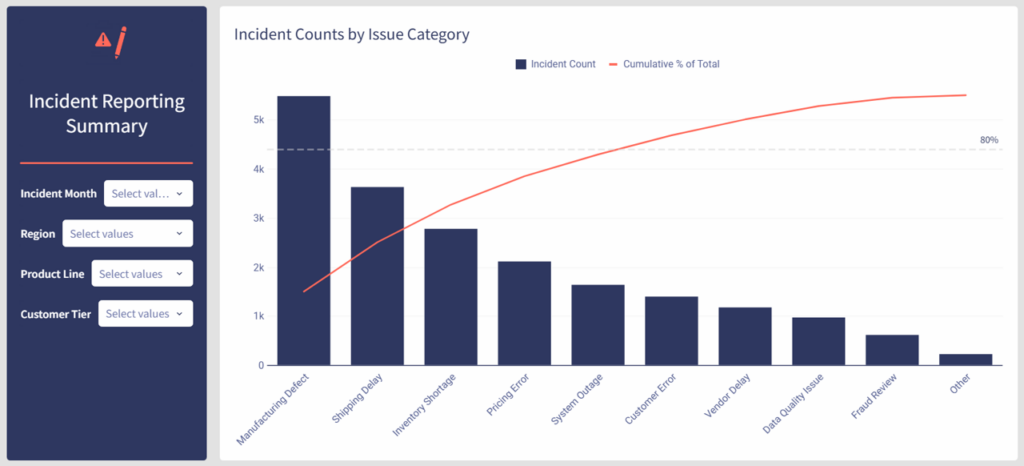
2025 Week 53 | Sigma : Can you build a pareto chart?

Introduction Welcome to the final week of 2025! Since it’s a holiday week, we’re keeping things simple with a classic but powerful visualization: the Pareto chart. Your challenge this week is to build a Pareto chart in Sigma that highlights which issue categories contribute the most to overall incident reports. By combining a sorted bar

2025 Week 53 | Sigma : Can you build a pareto chart? Read More »

Sigma, Workout Wednesday

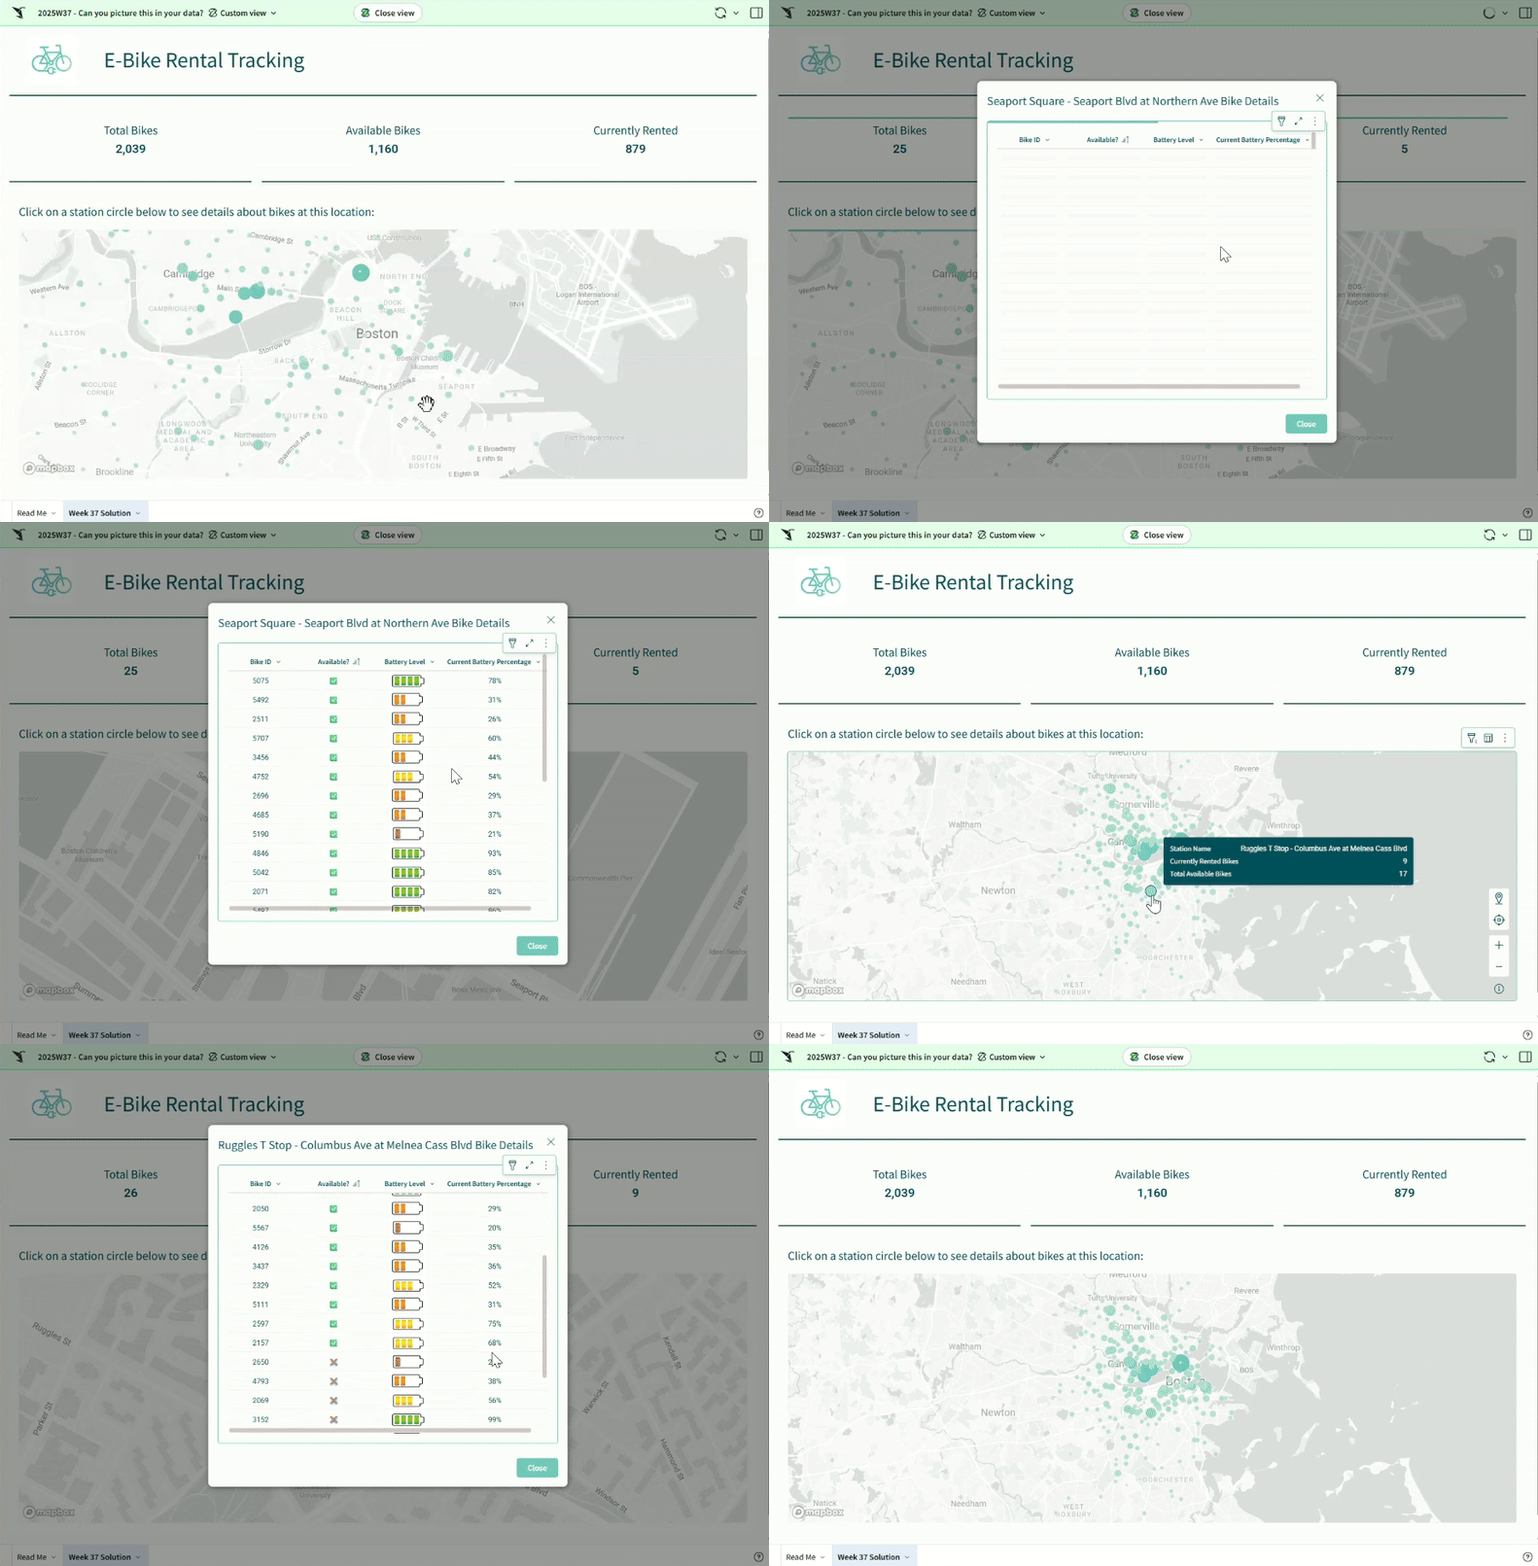
2025 Week 37 | Sigma : Can you picture this in your data?

Introduction Welcome to Week 37 of 2025! Numbers tell the story, but sometimes a picture says it faster. This week we’re charging up our Sigma skills by adding images into table cells and playing with maps. You’ll learn how to make your tables more visual, show dynamic elements like battery levels or icons, and bring

2025 Week 37 | Sigma : Can you picture this in your data? Read More »

Sigma, Workout Wednesday

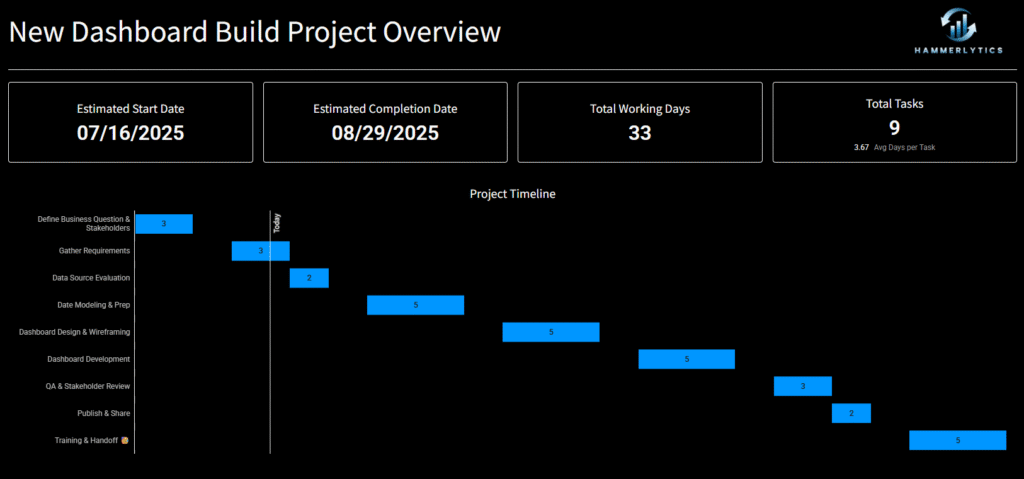
2025 Week 29 | Sigma : Gantt Touch This

Introduction Welcome to Week 29 of 2025! This week’s challenge is all about bringing back a tried-and-true classic: the Gantt chart. Whether you’re mapping out project timelines or visualizing task dependencies, this is your chance to put a clean, modern spin on one of the original BI visuals. Build something in Sigma that’s as functional

2025 Week 29 | Sigma : Gantt Touch This Read More »

Sigma, Workout Wednesday
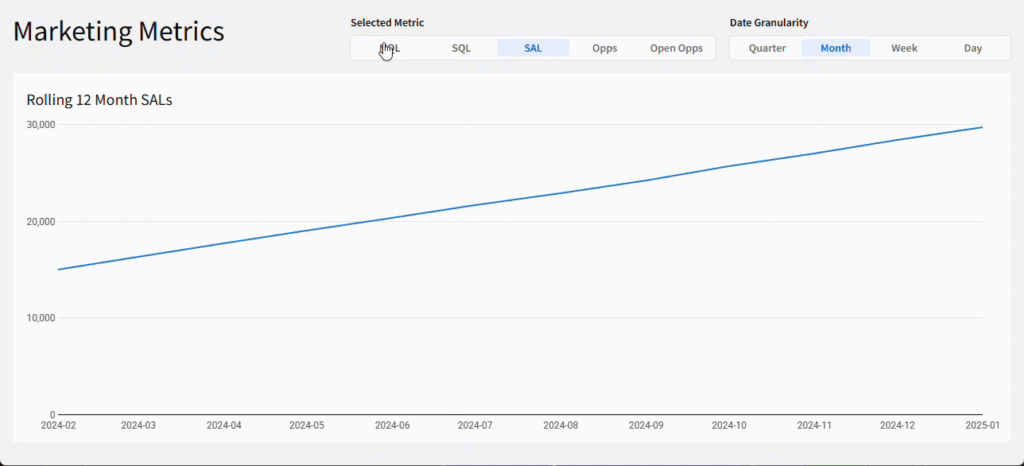
an image of a user interface with a line chart.

2025 Week 01 | Sigma: Can you visualize NHIS data?

Introduction Welcome to year 2 of Workout Wednesday, we’re here to help you keep good on your New Year’s resolutions of learning new skills and getting your teeth cleaned. The data for this week comes from the National Health Interview Survey (NHIS) website, which has a lot of interesting survey data to explore. They have

2025 Week 01 | Sigma: Can you visualize NHIS data? Read More »

Sigma, Workout Wednesday