Author name: Jess Batten

2025 Week 53 | Sigma : Can you build a pareto chart?

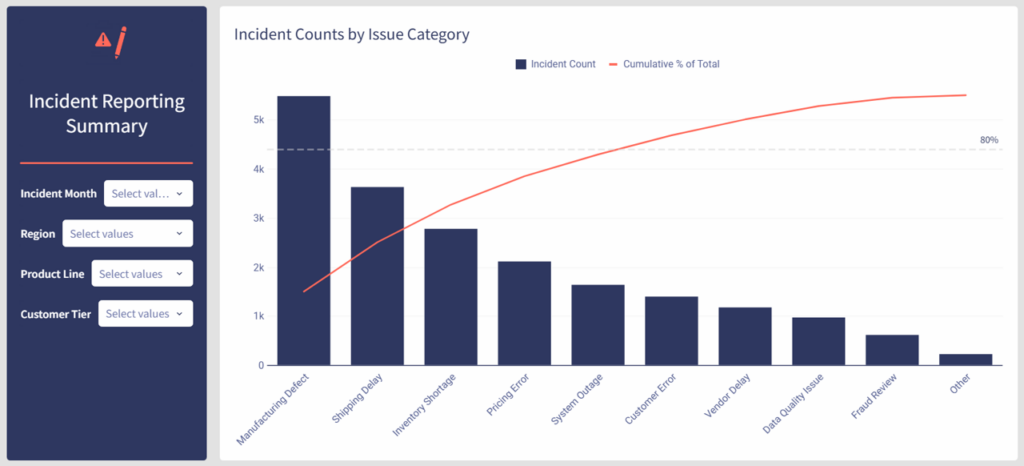
Introduction Welcome to the final week of 2025! Since it’s a holiday week, we’re keeping things simple with a classic but powerful visualization: the Pareto chart. Your challenge this week is to build a Pareto chart in Sigma that highlights which issue categories contribute the most to overall incident reports. By combining a sorted bar […]

2025 Week 53 | Sigma : Can you build a pareto chart? Read More »

Sigma, Workout Wednesday
2025 Week 37 | Sigma : Can you picture this in your data?

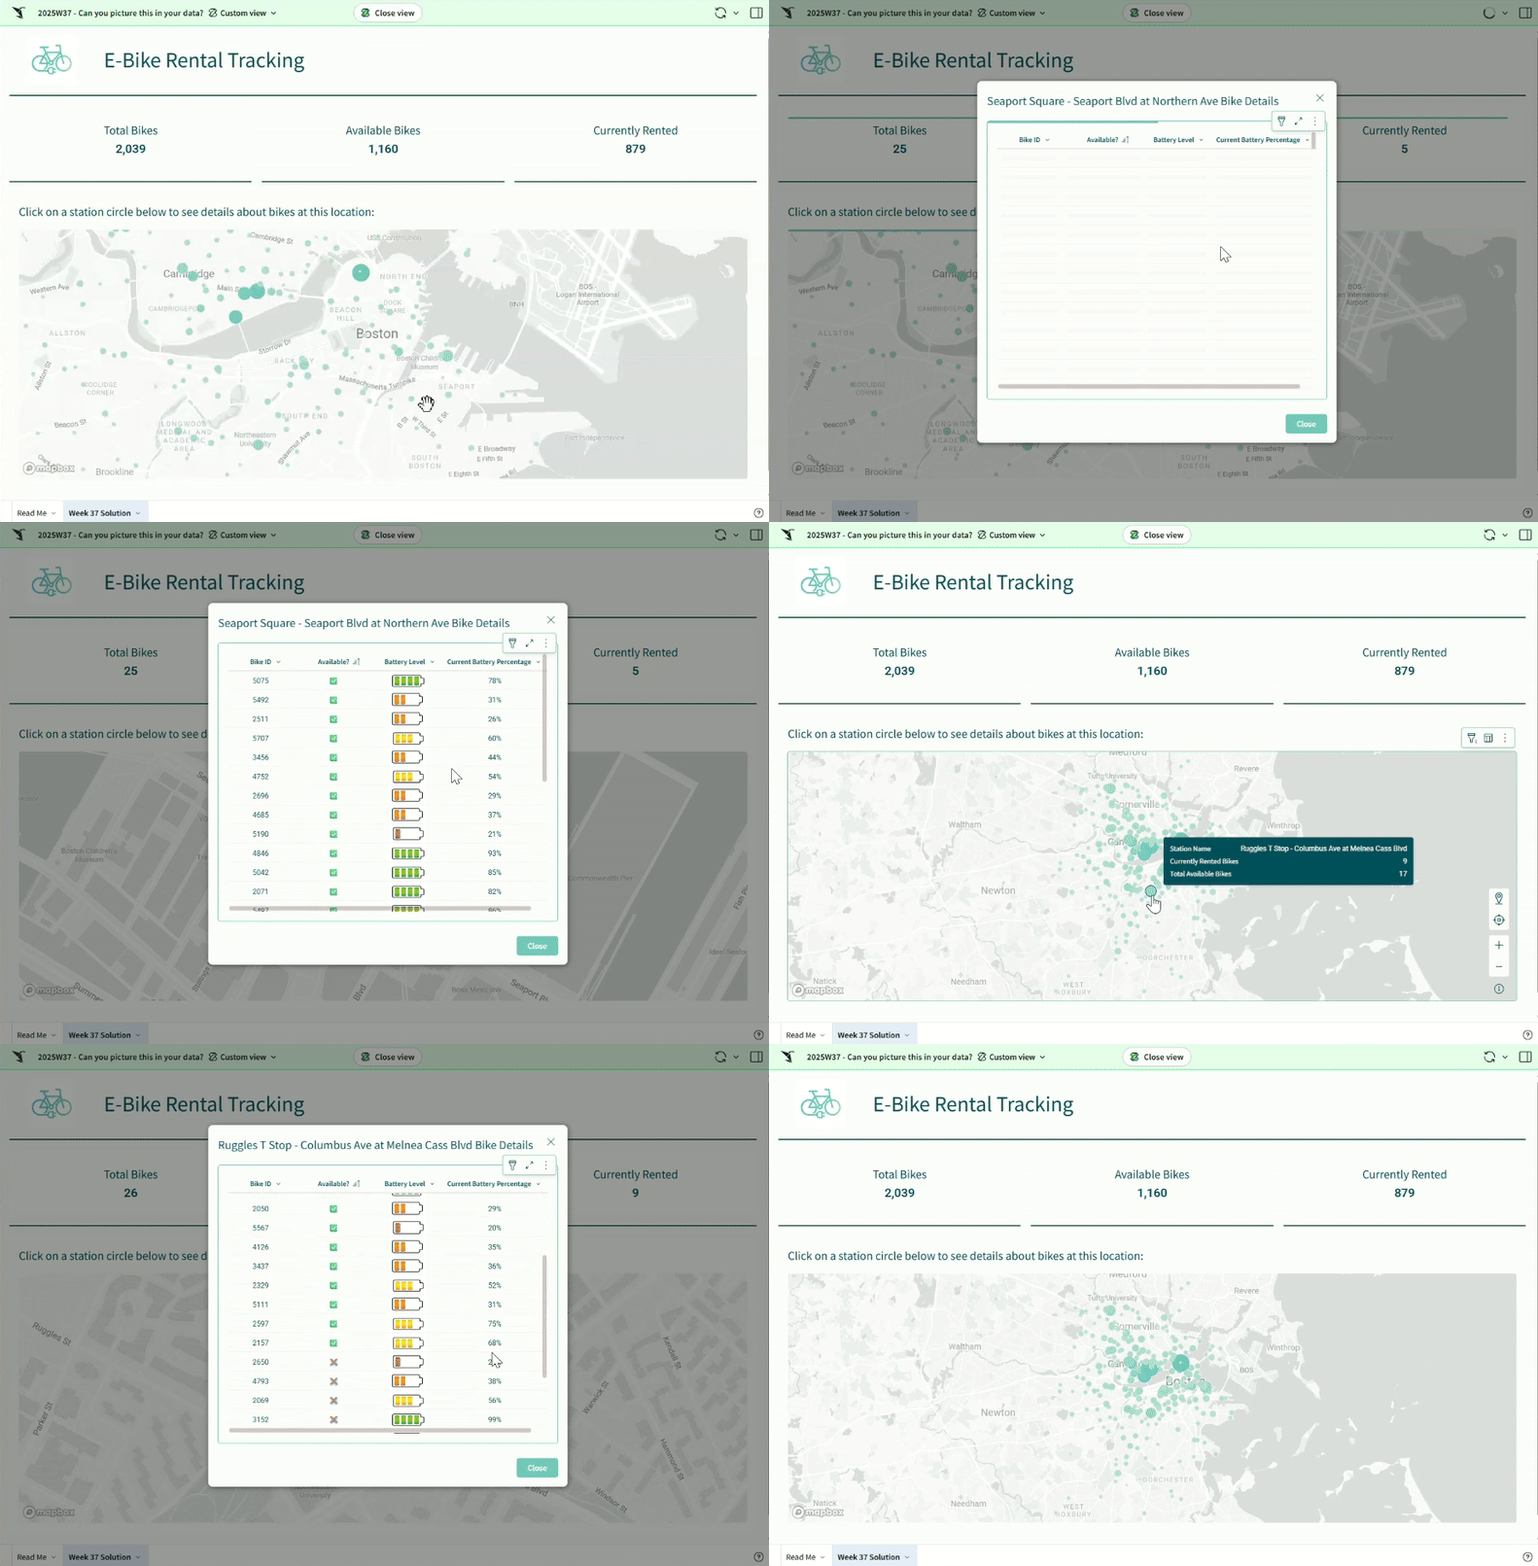
Introduction Welcome to Week 37 of 2025! Numbers tell the story, but sometimes a picture says it faster. This week we’re charging up our Sigma skills by adding images into table cells and playing with maps. You’ll learn how to make your tables more visual, show dynamic elements like battery levels or icons, and bring

2025 Week 37 | Sigma : Can you picture this in your data? Read More »

Sigma, Workout Wednesday
2025 Week 33 | Sigma : Can you cross filter tables?

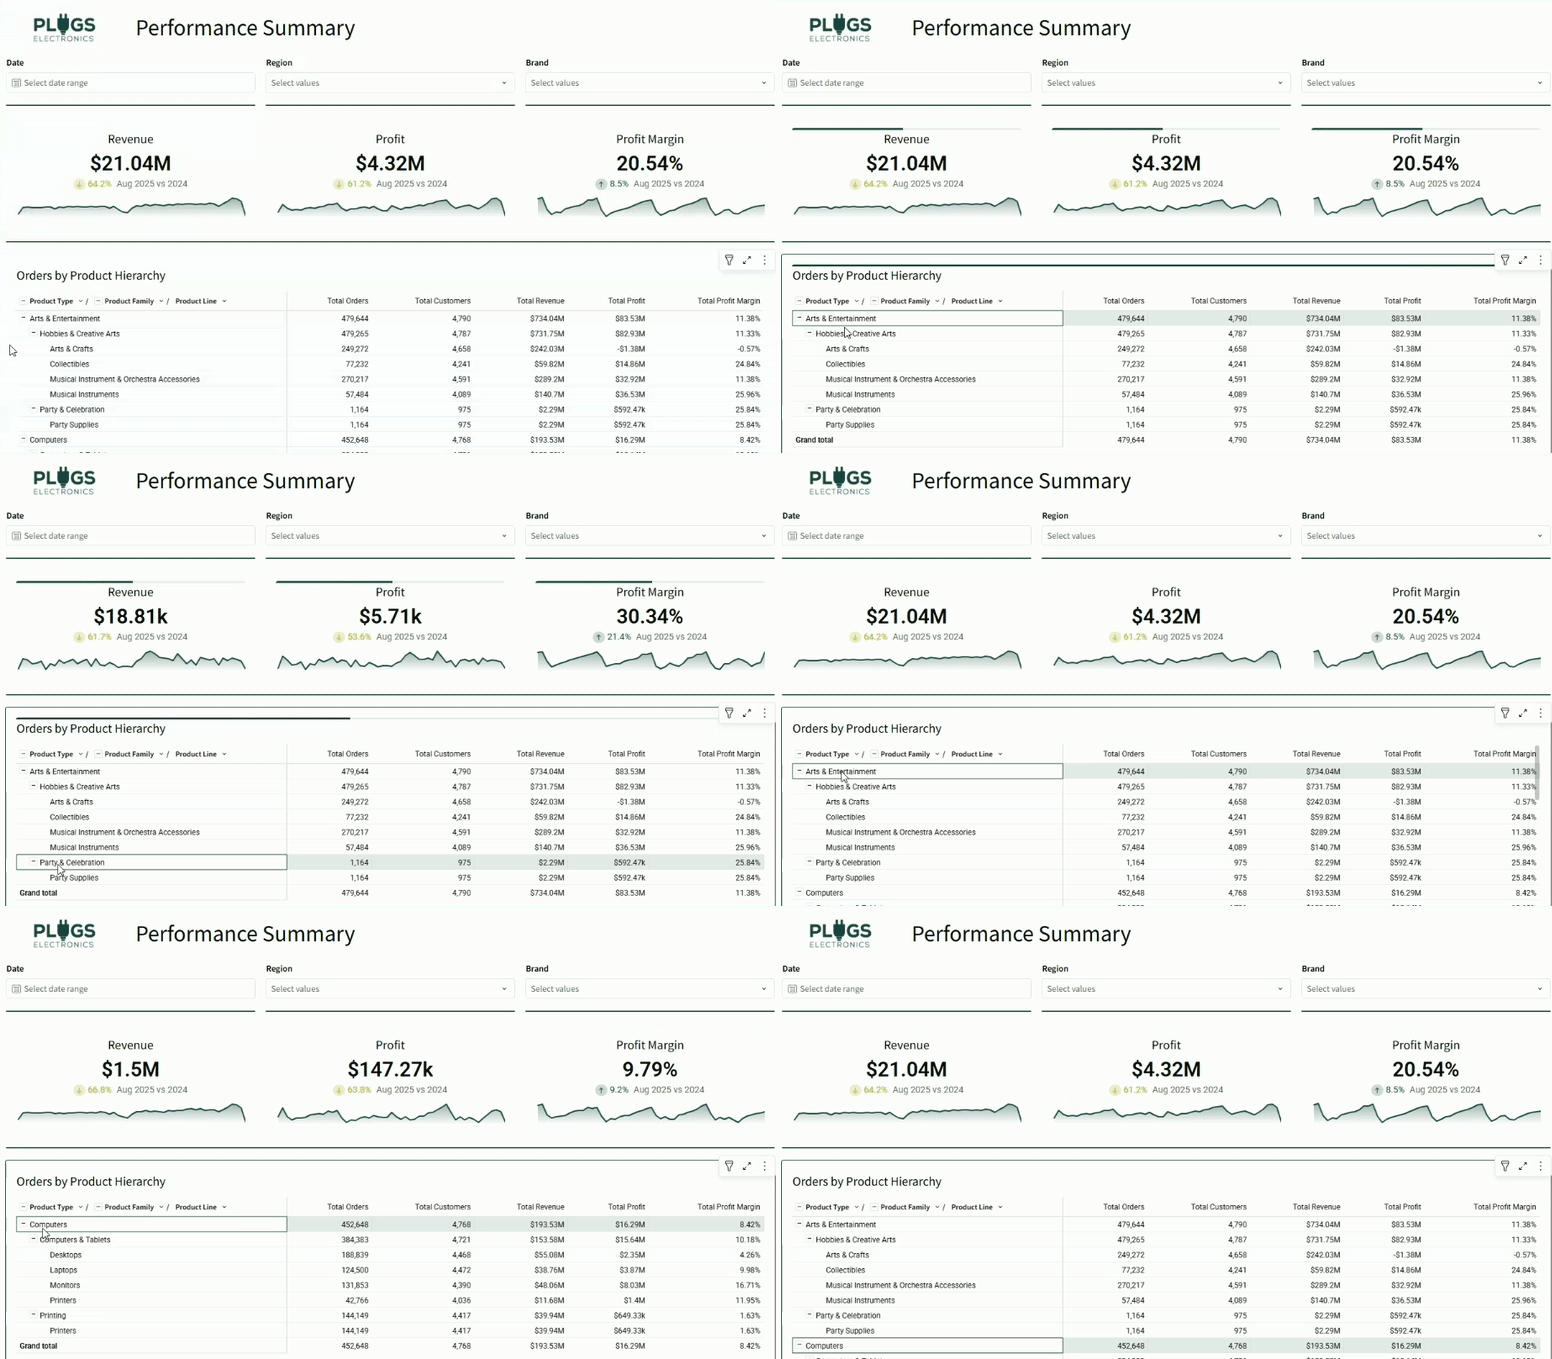
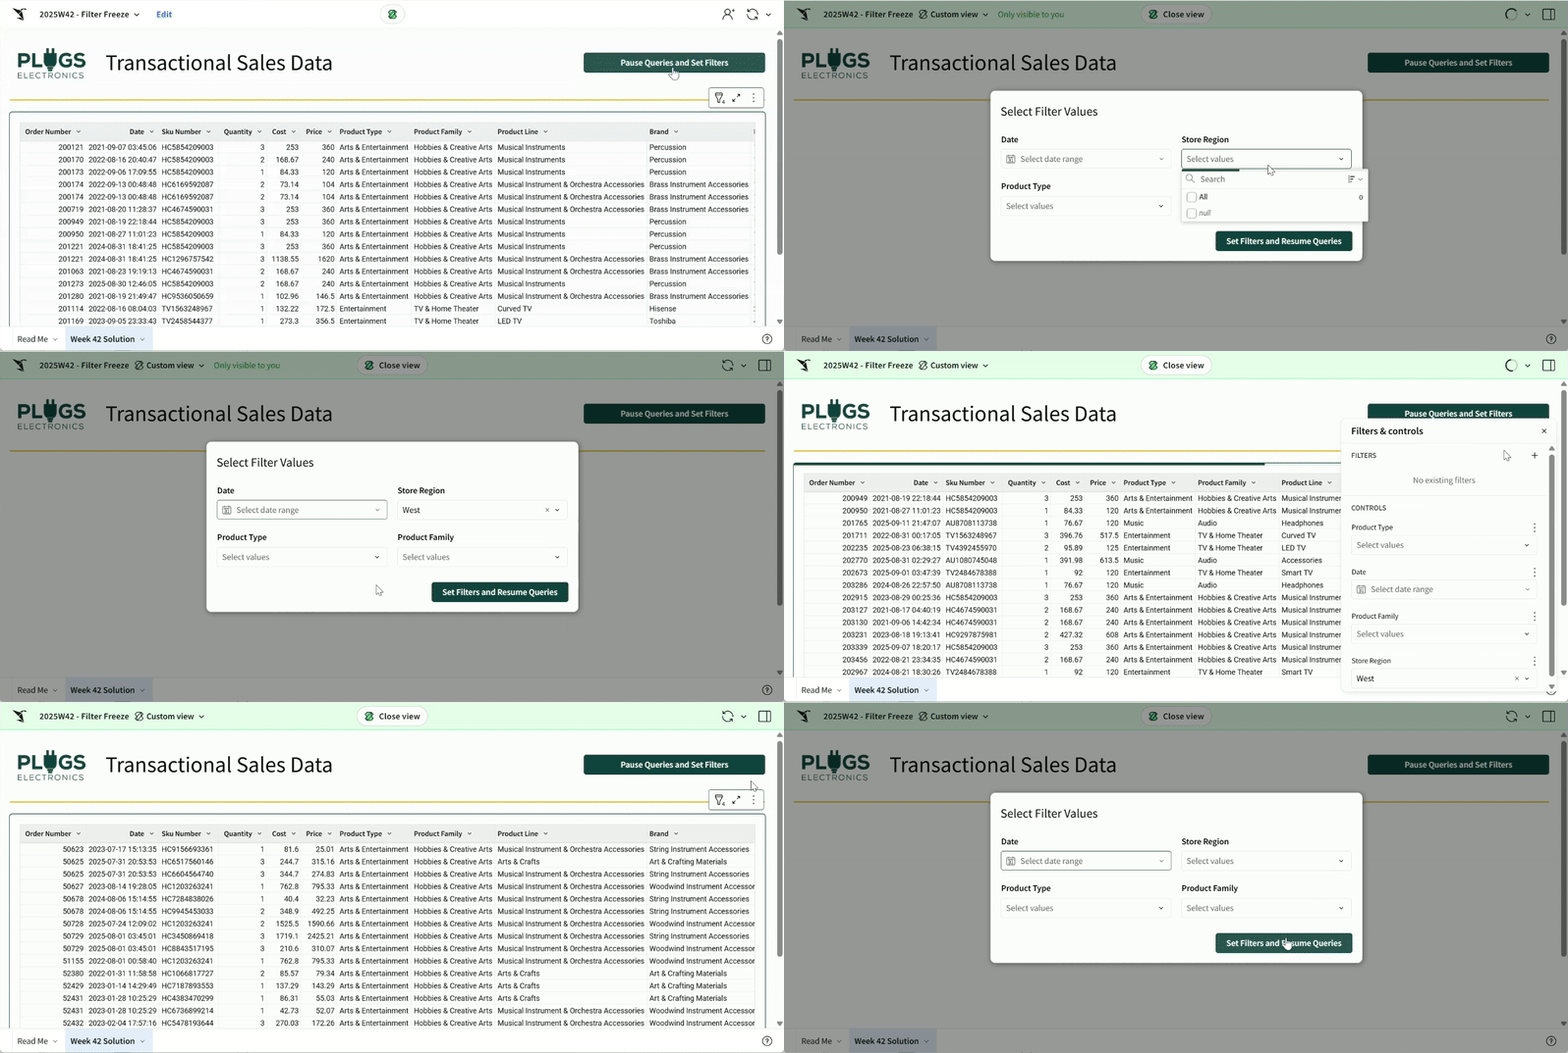
Introduction Welcome to Week 33 of 2025! We’ve all been there: you want to cross filter a dashboard by clicking on a field, and just as easily clear the selection. With charts, it’s easy – just click the white space. But with tables, it can be a little trickier. This week’s challenge: master cross-filtering from

2025 Week 33 | Sigma : Can you cross filter tables? Read More »

Sigma, Workout Wednesday
2025 Week 29 | Sigma : Gantt Touch This

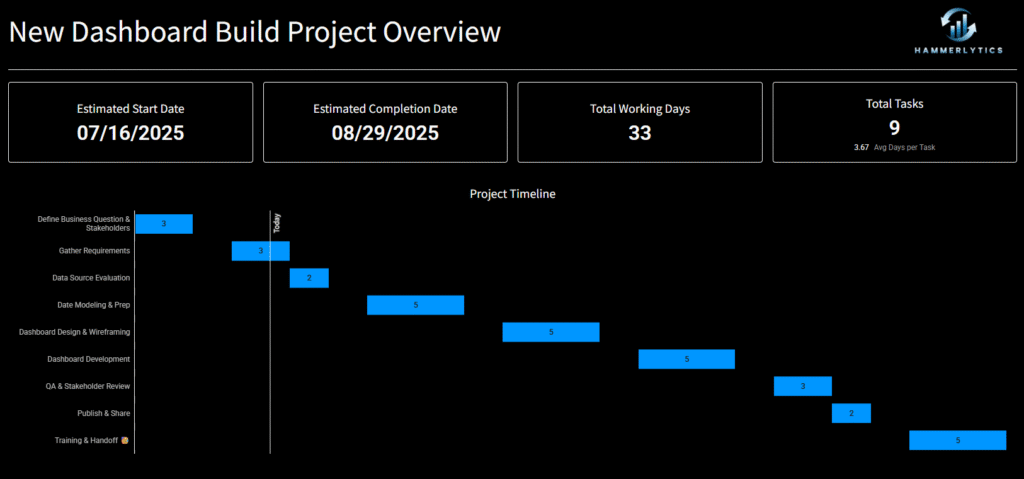
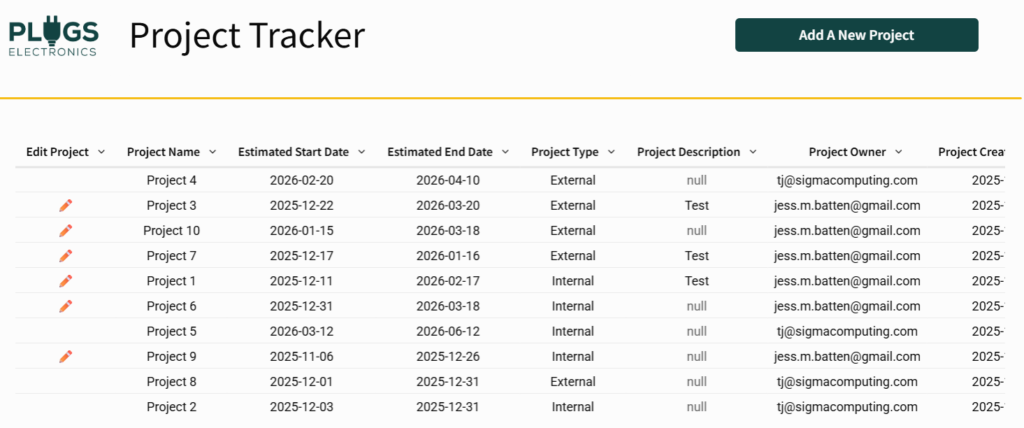
Introduction Welcome to Week 29 of 2025! This week’s challenge is all about bringing back a tried-and-true classic: the Gantt chart. Whether you’re mapping out project timelines or visualizing task dependencies, this is your chance to put a clean, modern spin on one of the original BI visuals. Build something in Sigma that’s as functional

2025 Week 29 | Sigma : Gantt Touch This Read More »

Sigma, Workout Wednesday