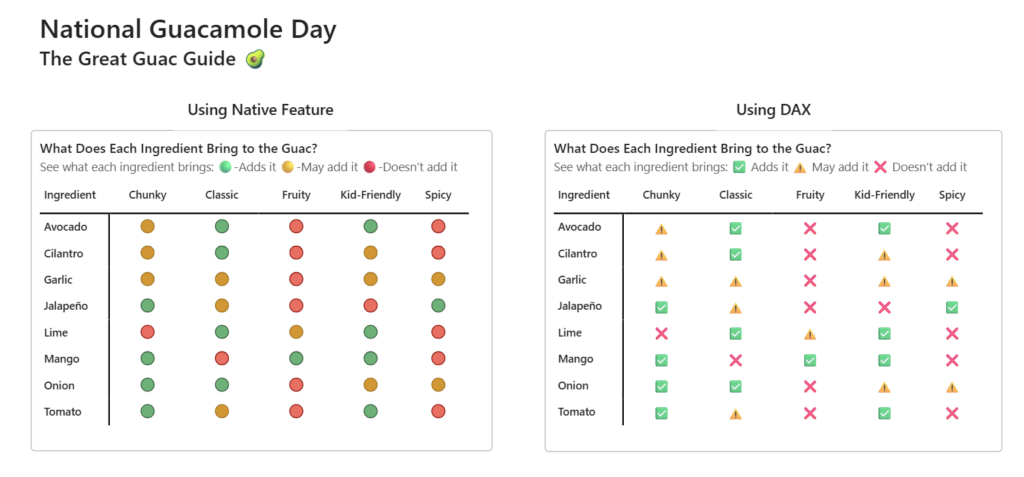
2026 Week 37 | Power BI: Categorical Icon Matrix
Introduction Happy National Guacamole Day! As a big fan of guac, I wanted to celebrate by bringing together two of my favorite things- Power BI and guacamole. Because why simply enjoy a bowl of guac when you can also turn it into a data visualization? An Icon Matrix uses simple icons instead of repeating the […]
2026 Week 37 | Power BI: Categorical Icon Matrix Read More »
Power BI, Workout Wednesday