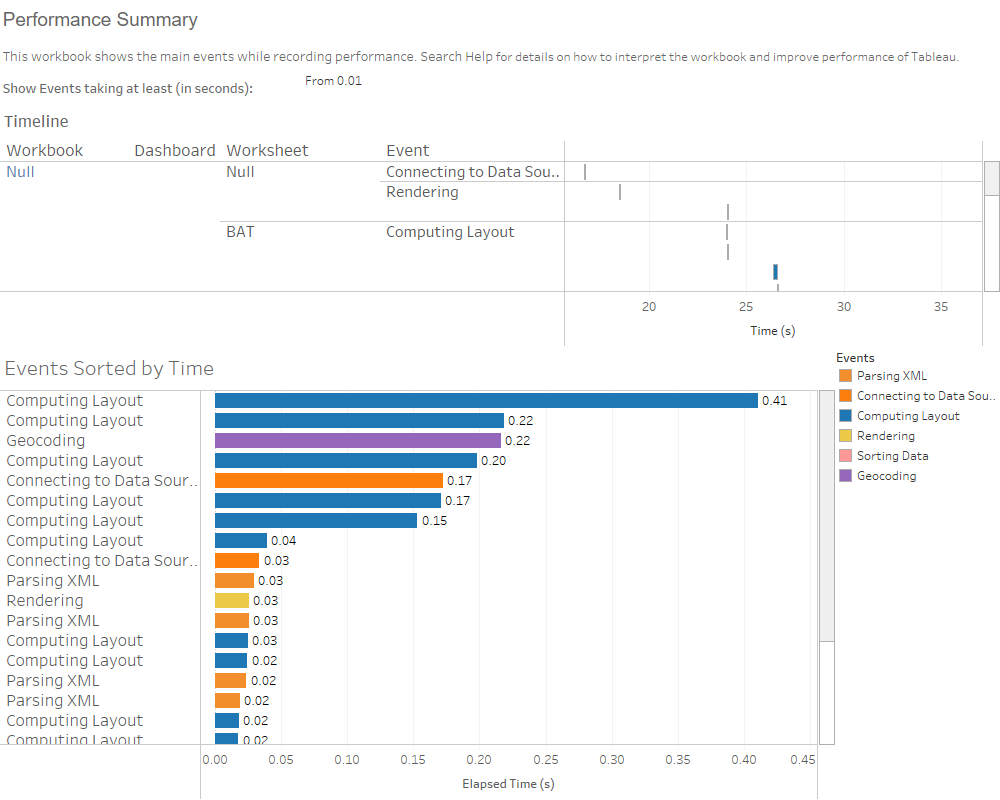
2021 Week 18: Can You Performance Tune This Workbook?
Introduction Learning complex techniques and beautiful design is super important to mastering visual analytics. But, nothing will stop a user from regularly and joyfully using a dashboard than a poor performing one. It doesn’t matter if it looks like Michaelangelo designed it or it has the cure for some crazy infectious disease – if it […]
2021 Week 18: Can You Performance Tune This Workbook? Read More »