Candra McRae

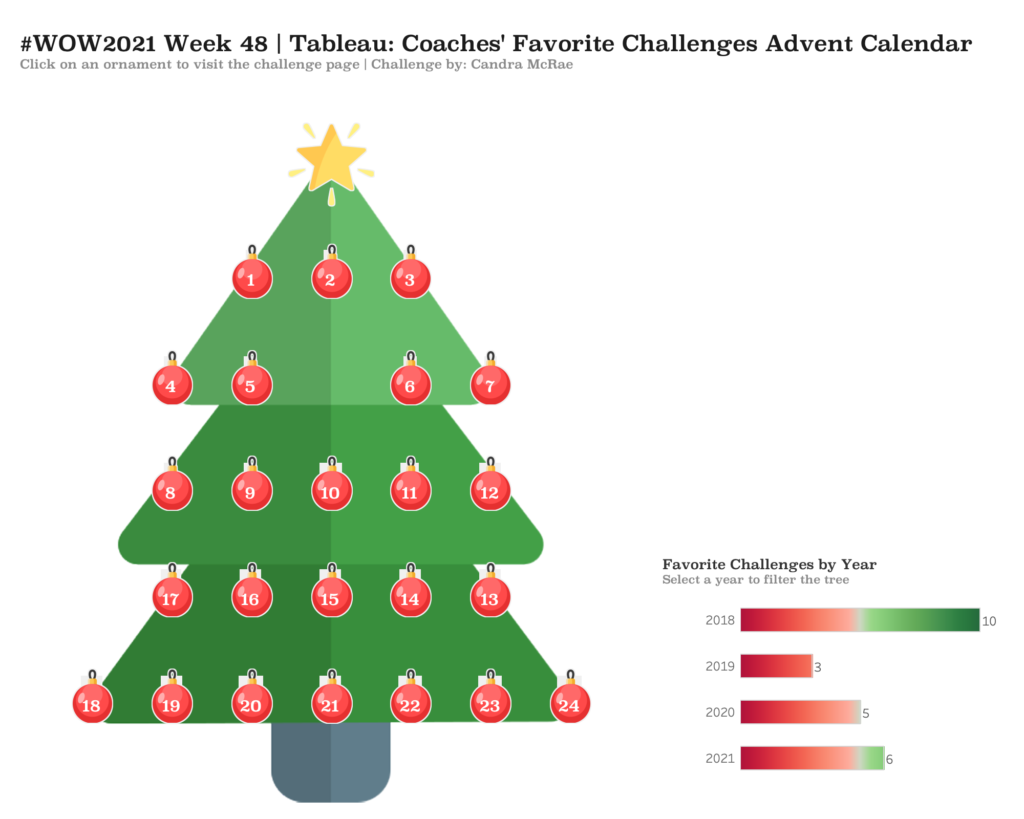
#WOW2021 Week 48 | Tableau | Coaches’ Favorite Challenges Advent Calendar

Introduction With the December right around the corner, holiday advent calendars will be everywhere. We didn’t want Workout Wednesday to miss out on that holiday tradition. So, we created an advent calendar featuring favorite challenges selected by our very own #WOW coaches. As my gift to you and a major development hint, I provided the …

#WOW2021 Week 48 | Tableau | Coaches’ Favorite Challenges Advent Calendar Read More

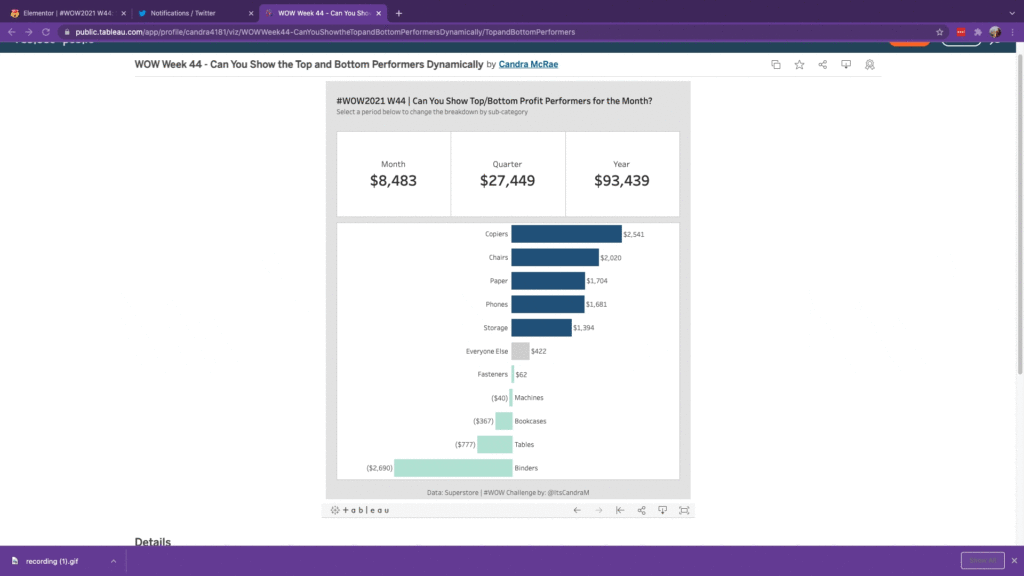
#WOW2021 W44: Can You Show the Top and Bottom Profit Performers for the Selected Time Period?

Introduction To round out my beginner #WOW2021 series and as a nod to the most wonderful time of the year (#TC…duh), I wanted to re-imagine a couple of blasts from the Tableau Conference past…so while no points for originality here, my hope is that the principles of these tricks of the trade will help reduce …

#WOW2021 W44: Can You Show the Top and Bottom Profit Performers for the Selected Time Period? Read More

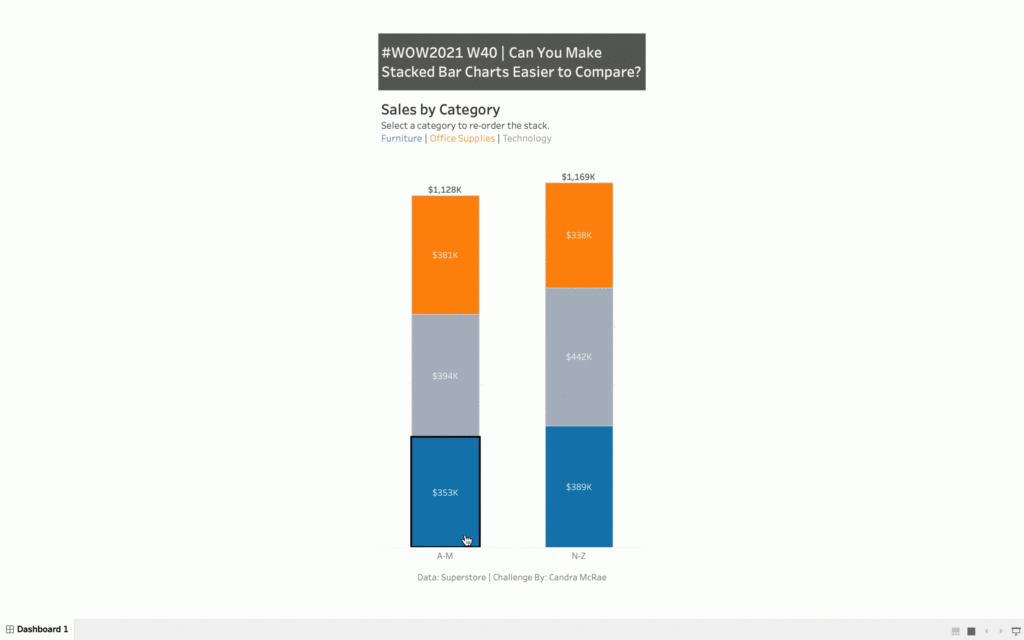
2021 W40 | Tableau: Can You Make Stacked Bar Charts Easier to Compare?

Introduction I have a confession to make…I like stacked bar charts. Someone once referred to them as rectangular pie charts, which stung a little bit – so I’ve kept my affinity quiet. Stacked bar charts get a bad rap because it can be hard to compare the different components – in fact the only one …

2021 W40 | Tableau: Can You Make Stacked Bar Charts Easier to Compare? Read More

2021 W38 | Tableau: How Can You Quickly Tell the Net Change Between Two Dates? (Community Challenge)

Introduction This week’s challenge is by Will Perkins About Will: Will has been actively involved with the external Tableau Community over the past 3 years. He has spoken at Tableau Fringe Fests, multiple TUGs, and mentored various individuals in one-off questions or more long term instances. At work, he has helped build an internal global …

2021 W38 | Tableau: How Can You Quickly Tell the Net Change Between Two Dates? (Community Challenge) Read More

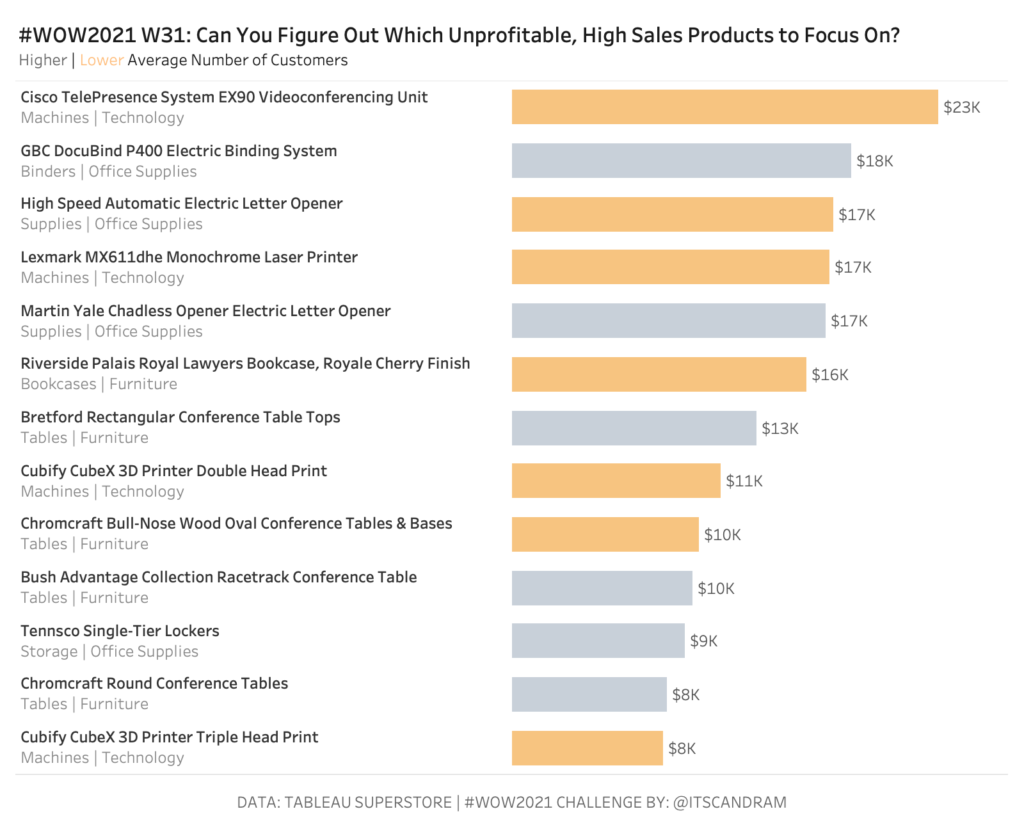
2021 Week 31: Can You Find the Needle in the Haystack?

Introduction The ability to efficiently find the proverbial needle in a haystack is worth its weight in gold.  How many times has a key stakeholder asked you to give them a shortlist of products (insert the focus of your analysis) to focus on for business improvement/optimization opportunities…and they’ve asked you to get back to them …

2021 Week 31: Can You Find the Needle in the Haystack? Read More

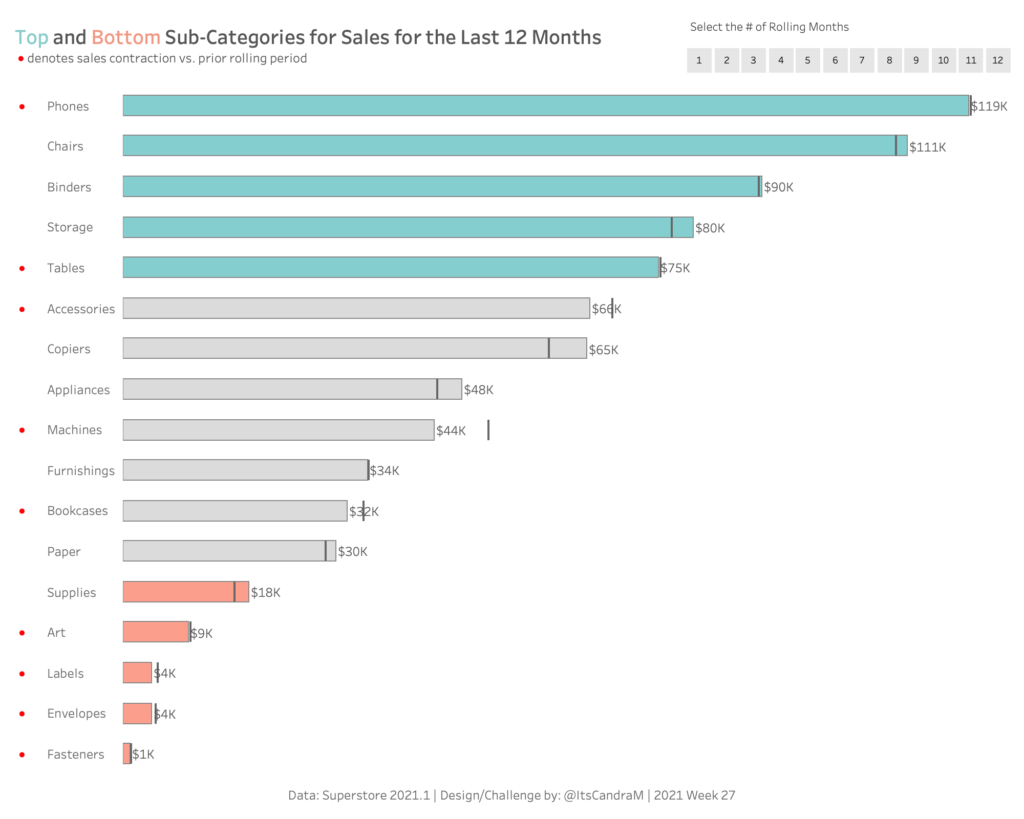
2021 Week 27: Can you find the top and bottom performers?

Introduction Like a fine pinot grigio, I really enjoy a good box-and-whisker plot. There is so much good stat stuff in one place like the min/max, median, top/bottom performers, and outliers in the data set.  I have found, however, that they are rarely used and some business end users find them hard to read.    …

2021 Week 27: Can you find the top and bottom performers? Read More

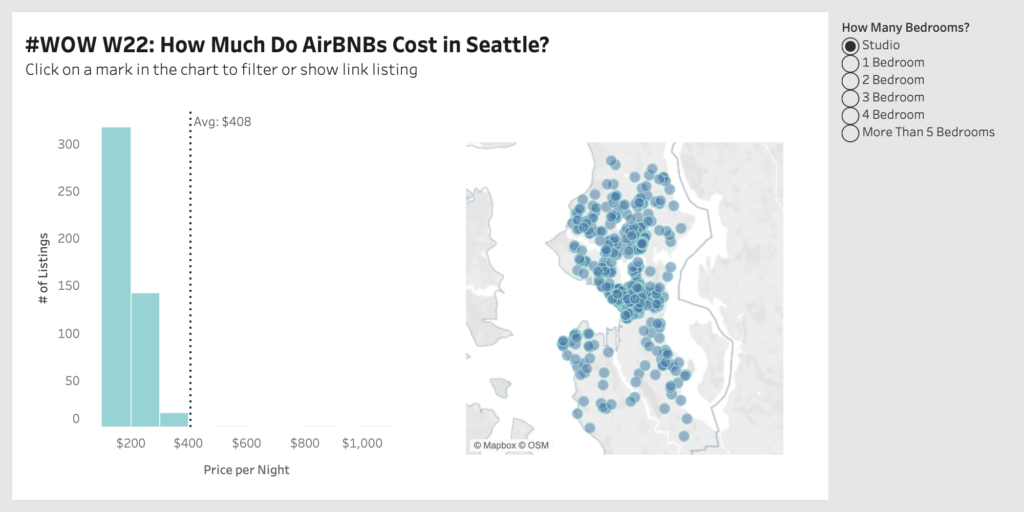
#WOW2021 week 22: Can You Structure the Unstructured?

Introduction Data analyst is supposedly the sexiest job of the 21st century.  Most people think that we spend our time building amazing models, visualizations, or insights all day.  What they don’t know is that you spend nearly most of your time cleaning data.  Some data is nice and refined (aka usable) and other data needs …

#WOW2021 week 22: Can You Structure the Unstructured? Read More

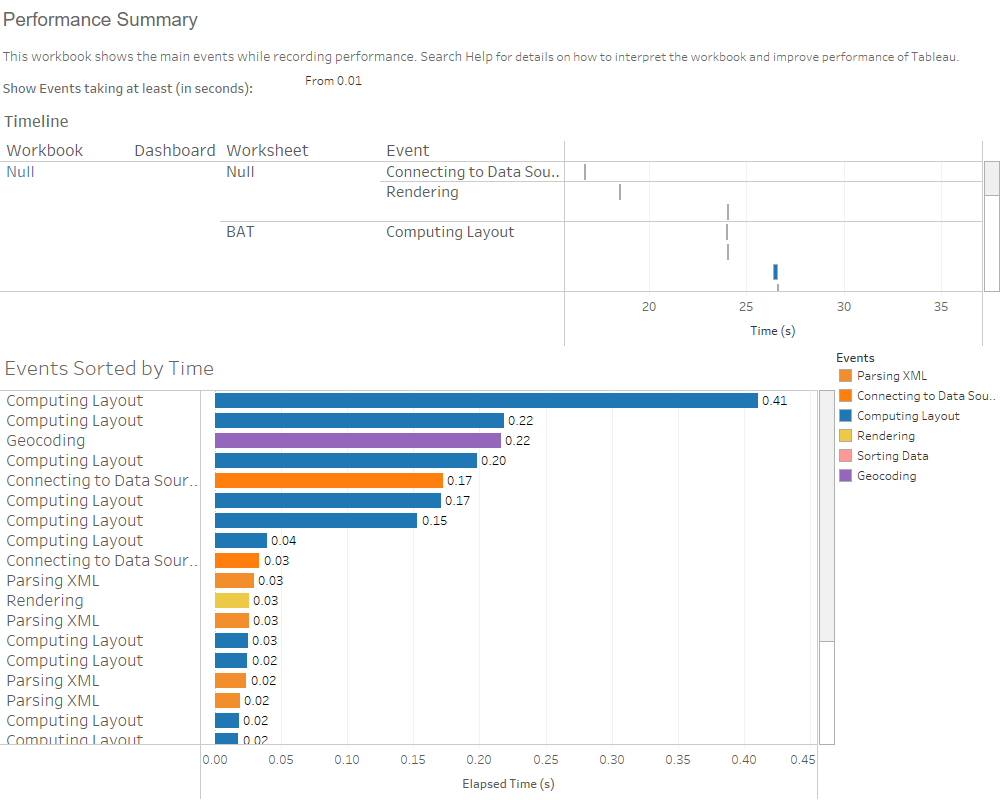
2021 Week 18: Can You Performance Tune This Workbook?

Introduction Learning complex techniques and beautiful design is super important to mastering visual analytics.  But, nothing will stop a user from regularly and joyfully using a dashboard than a poor performing one.  It doesn’t matter if it looks like Michaelangelo designed it or it has the cure for some crazy infectious disease – if it …

2021 Week 18: Can You Performance Tune This Workbook? Read More

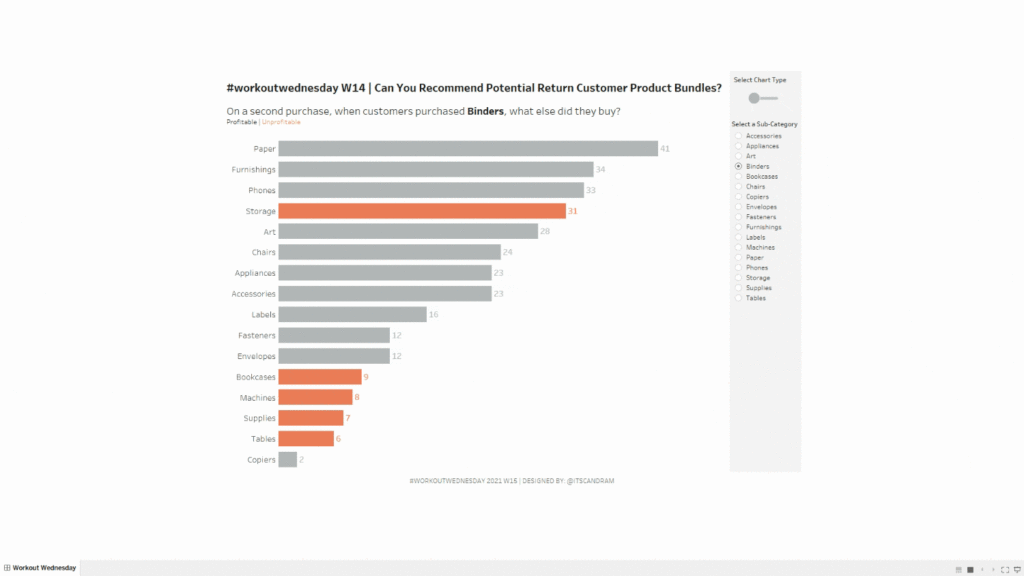
2021 Week 14 | Tableau: Can You Recommend Profitable Return Customer Bundles?

Introduction Have you ever purchased something on Amazon and they show an extra random list of products in the “Customers that purchased X also purchased…” section and you think to yourself, “How in the world did they come up with that combination (e.g., sponges and Skittles)?”  They likely have high-powered recommender engines doing all of …

2021 Week 14 | Tableau: Can You Recommend Profitable Return Customer Bundles? Read More

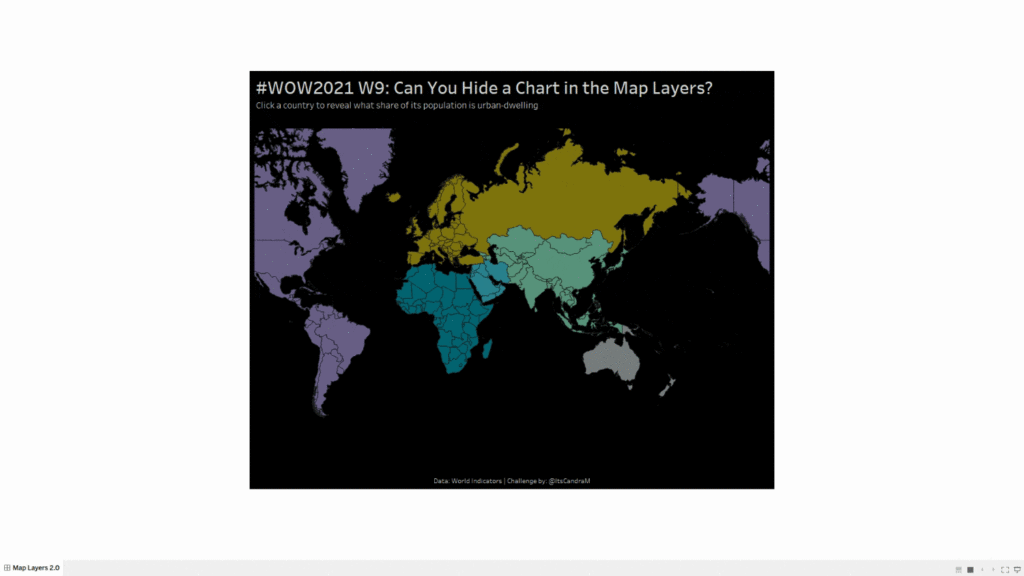
2021 Week 9: Can You Hide A Chart in the Map Layers?

Introduction So, I’m a little late for Mardi Gras – but that didn’t stop me from thinking about King Cake, a New Orleans tradition (with French roots) where a little plastic baby is put inside of a cake that is plastered with green, yellow, and purple frosting with tons of sprinkles. Anyone teeth hurt yet? …

2021 Week 9: Can You Hide A Chart in the Map Layers? Read More

Scroll to Top