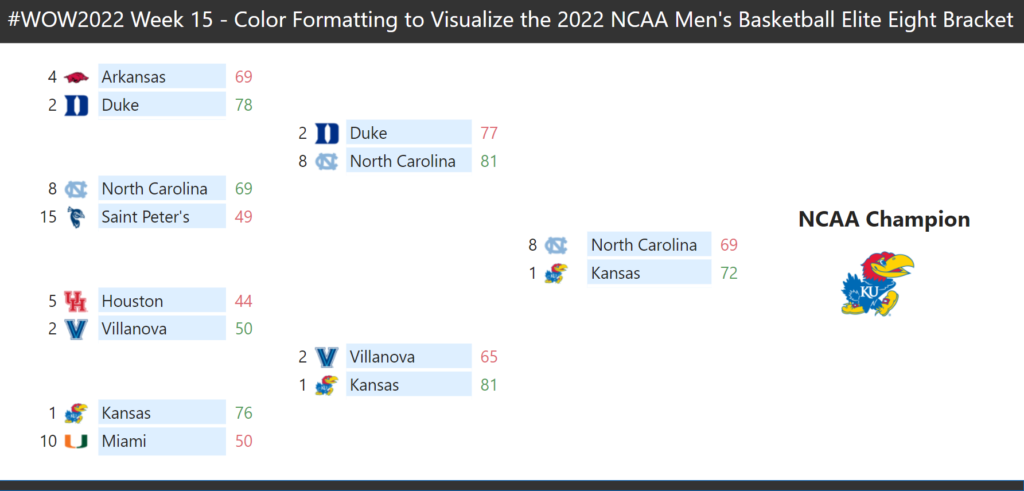
Workout Wednesday

2022 Week 10 | Power BI: Risk Matrix

Introduction Your challenge this week is to create a Risk Matrix with some supporting visuals.  We decided to keep the project management theme going this week.  If you did not do last week’s challenge, I highly recommend you checkout Kerry’s Gantt Chart challenge, here.   For this challenge, I looked at a lot of possible ways to create a […]

2022 Week 10 | Power BI: Risk Matrix Read More »

2022 Week 08 | Power BI: Can you make a Gantt Chart?

Introduction This week we are creating Gantt Charts in Power BI. It is not required to do all 4 variations, choose one of the options that interests you the most. Each option increases in time and/or experience level. Requirements QUICK MODE Import data Import the Microsoft Gantt Chart from AppSource Place Project Category in the

2022 Week 08 | Power BI: Can you make a Gantt Chart? Read More »

2022 Week 9: How many patients were admitted every 15 minutes?

Introduction This week we are going to look at hospital admission rates. This data source comes from The Medical Stays dashboard on the Tableau Exchange. This particular challenge is more focused on working with time than it is working with medical data. In this challenge you need to group time into 15 minute increments throughout

2022 Week 9: How many patients were admitted every 15 minutes? Read More »

Week 05 2022 Challenge

2022 Week 05 | Power BI: Can you make a Nested Chart with Charticulator?

Introduction This week we are familiarising ourselves with Charticulator and Nested Charts. This graph was inspired by Gus Wezerek and Sara Chodosh’s chart for NYT Opinion. Requirements Download the data and remove all columns excepting the Date field, New Cases Smoothed Field and Location (save as csv) Create a second csv with only Location =

2022 Week 05 | Power BI: Can you make a Nested Chart with Charticulator? Read More »