It’s no surprise that we tend to focus a lot on a myriad of various aggregate calculations because that’s a lot of responsibility. But it’s also good to focus on different aspects of Tableau. My favorite non-aggregate aspect of Tableau is all of the possible navigation options.
This week’s challenge is a page right out of a real-world project I worked on recently. Similar to the superstore product hierarchy, the data I was working with had multiple dimensions of high cardinality that were a hierarchy. We were looking for a way to display each level while taking up as little real estate as possible.
So I came up with this solution and knew immediately that it would make great WOW challenge. So here we go!
No more than 4. That’s what I used, I’m sure it could be done in fewer.
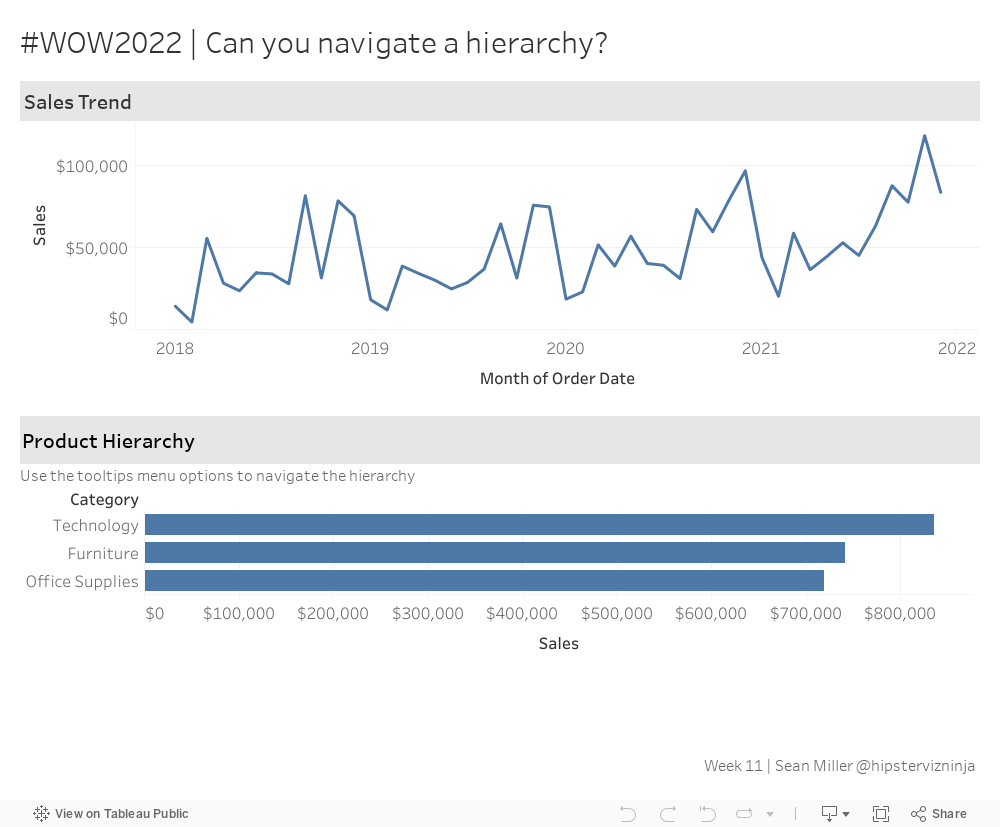
Create a line chart that displays Sales by Month
Below that, add a bar that allows the user to drill down (or up) between:
Category
Subcategory
Product Name
The Trend line title should be dynamic and act as a breadcrumb to show what has been selected
The trend line should filter to what is selected.
BONUS OPTIONAL CHALLENGE – Can you extend the width of the tooltip so that there in not any word wrap for the first two levels?
Dataset
This week uses an adapted Superstore data set. You can find it here on Data.World
Attribute
When you publish your solution on Tableau Public make sure to take the time and include a link to the original inspiration. Also include the hashtag #WOW2022 in your description to make it searchable!