Introduction
This week we are looking at HR headcount data. Headcount data can sometimes seem straightforward to work with, but sometimes the reporting rules can be a bit complicated–particularly with large organizations.
This week you will attempt to measure the headcount of a large organization using data from the Real World Fake Data project by Mark Bradbourne.
In this challenge, you will need to calculate the monthly headcount of an organization: the challenge any person hired doesn’t count for the month until the next month. This means if you were hired on February 22nd, 2019, you wouldn’t count in the data until March 2019.
This challenge will force you to think about how to use Tableau’s table calculations–and how you can properly nest table calculations.
You will also need to manipulate the data (in Tableau) to be able to add and subtract headcount.
Requirements
- Dashboard Size: 1000px by 800 px
- 1 of Sheet
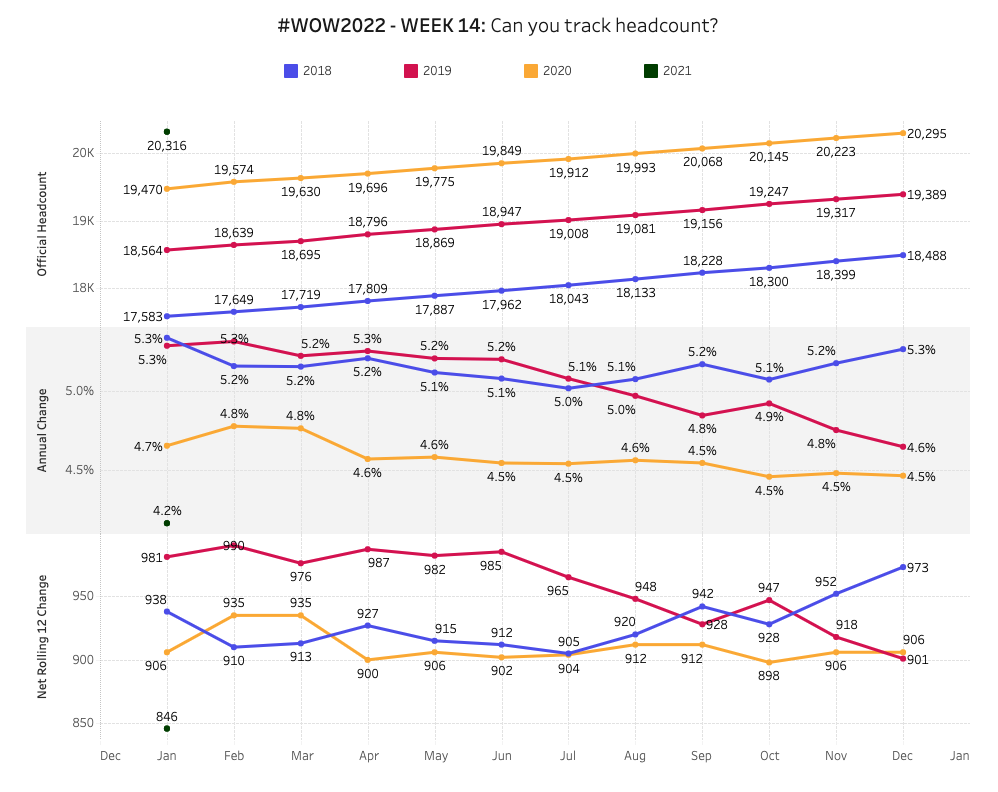
- Calculate the total headcount for each month. Hire and attrition doesn’t count until the next month
- Calculate the year-over-year change of any month
- Calculate the rolling 12 month headcount change for each month
- Match the formatting (#5557EB, #D81159, #FBB13C, #004500)
Dataset
This week uses the data from the Human Resources data source from Real World Fake Data. Download the data and start building.
Attribute
When you publish your solution on Tableau Public make sure to take the time and include a link to the original inspiration. Also include the hashtag #WOW2022 in your description to make it searchable!
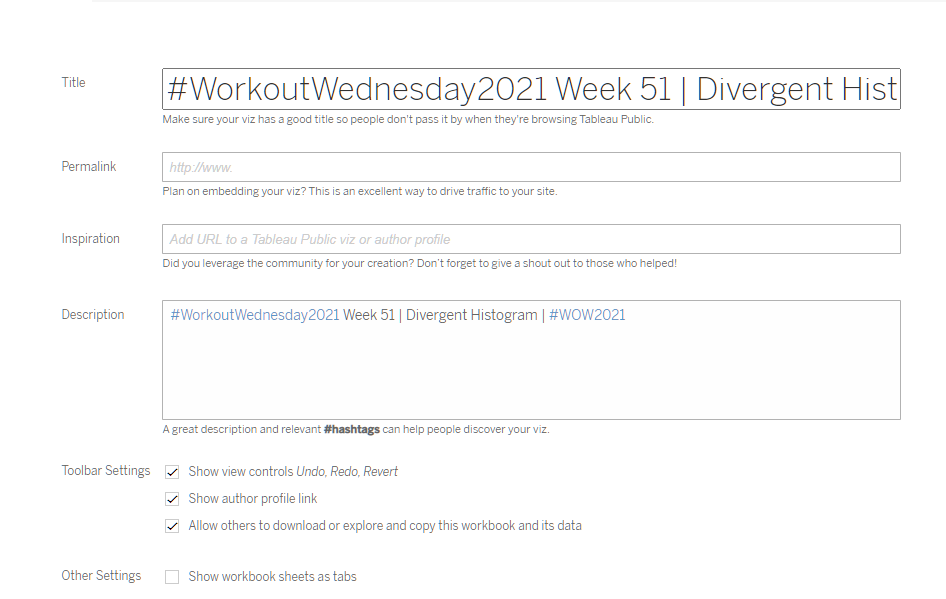
Share
After you finish your workout, share on Twitter using the hashtag #WOW2021 and tag @LukeStanke, @_Lorna_Brown, @_hughej, @YetterDataViz and @HipsterVizNinja