Workout Wednesday

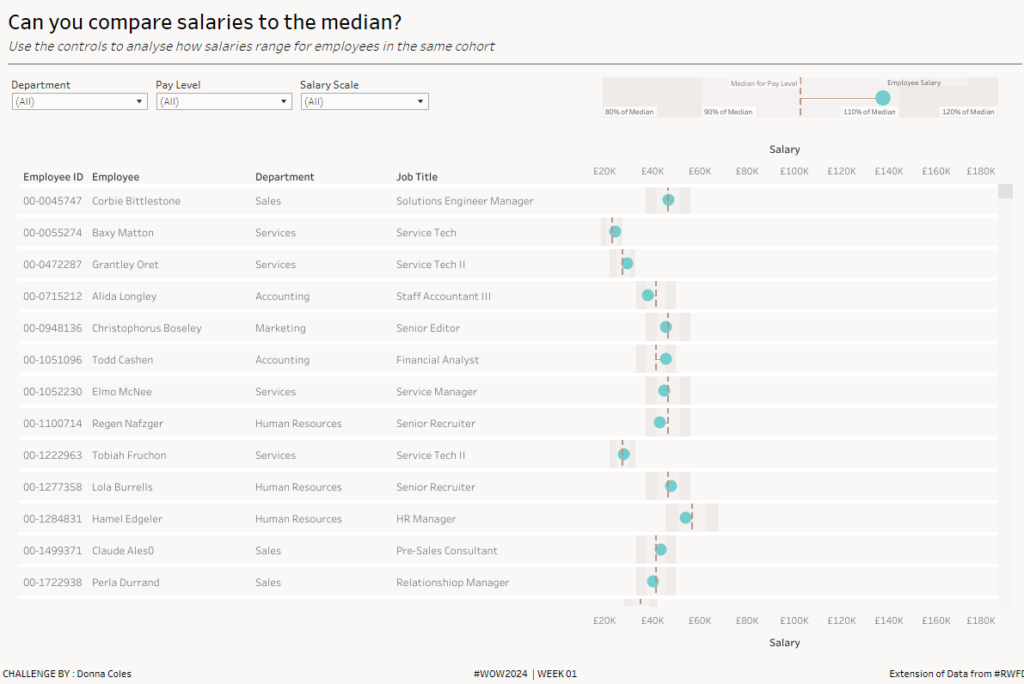
#WOW2024 | Week 1 | Can you compare salaries to the median?

Introduction Happy New Year to you all! This is the start of #WorkoutWednesday’s 7th year – how amazing is that! Thank you to everybody for your continued support and engagement – it really helps keep this initiative going! For the first challenge of 2024, I’ve updated a visualisation I first built several years ago based […]

#WOW2024 | Week 1 | Can you compare salaries to the median? Read More »

Tableau, Workout Wednesday
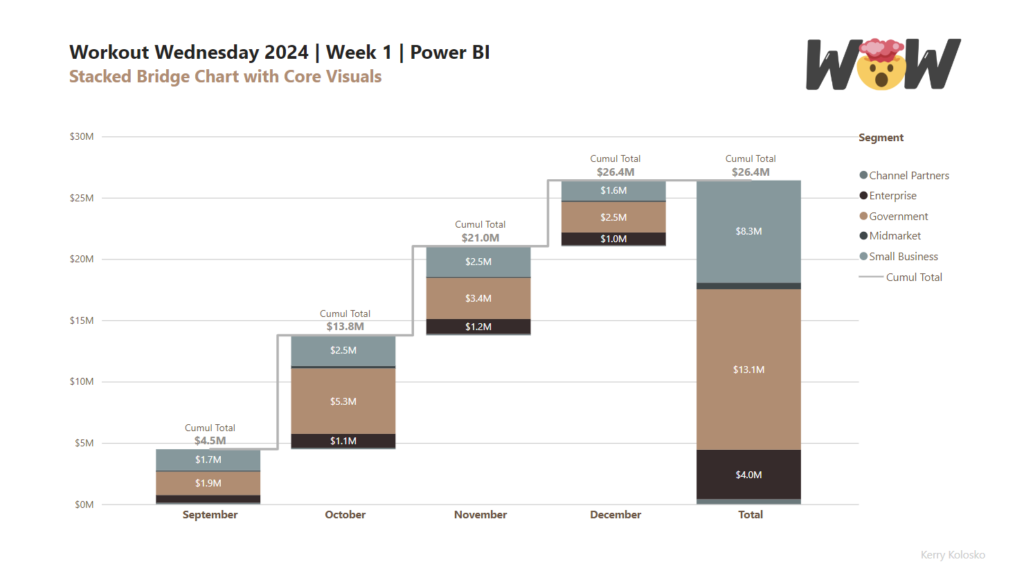

2024 Week 1 | Power BI: Stacked Bridge with Core Visual

Introduction This week’s challenge builds on last weeks challenge to utilise updated column fill and data labelling features from the Power BI December 2023 release. The challenge will be to create a stacked bridge chart using the core column and line combo chart. Building the bridge will require calculated tables. Intermediate users can use the

2024 Week 1 | Power BI: Stacked Bridge with Core Visual Read More »

Power BI, Workout Wednesday

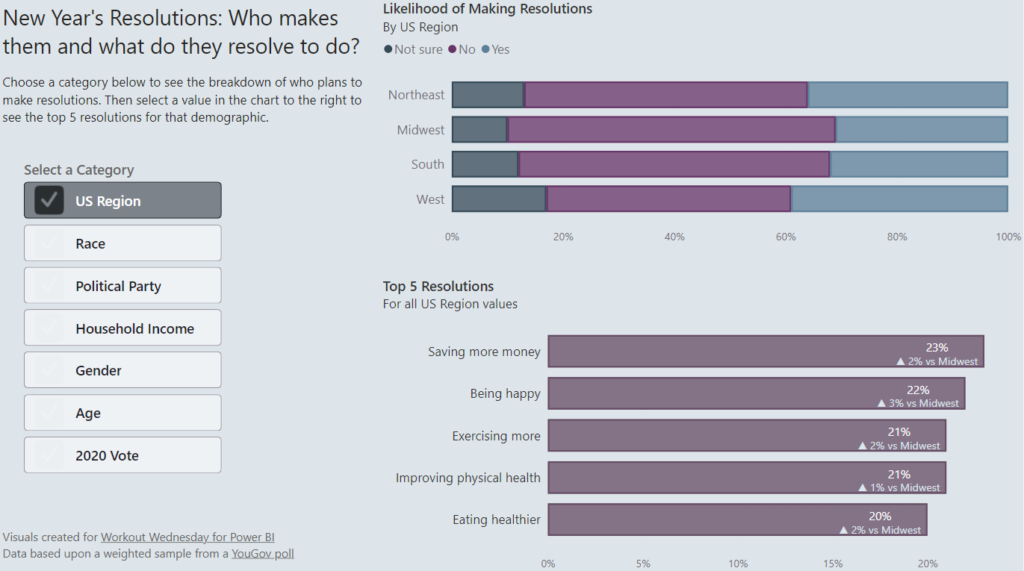
2023 Week 52 | Power BI: Format Bar Charts with Transparency, Borders, and Detail Labels

Introduction In the December 2023 release of Power BI Desktop, some new formatting options were added for bar charts. These enhancements allow us to add borders around bars (and segments of bars for stacked bar charts), change the transparency of the fill color in a bar, and add secondary metrics to data labels.  With the

2023 Week 52 | Power BI: Format Bar Charts with Transparency, Borders, and Detail Labels Read More »

Power BI, Workout Wednesday

2023 Week 50 | Power BI: Clippy’s Random Gift Generator

Introduction Happy holidays to everyone who celebrates! Join us this week to get some help shopping for your friends and family, using a dataset you provide and a random number generator in Power Query. If Clippy can’t pick a gift, no one can! Have fun and create the random gift generator in whatever way you

2023 Week 50 | Power BI: Clippy’s Random Gift Generator Read More »

Power BI, Workout Wednesday

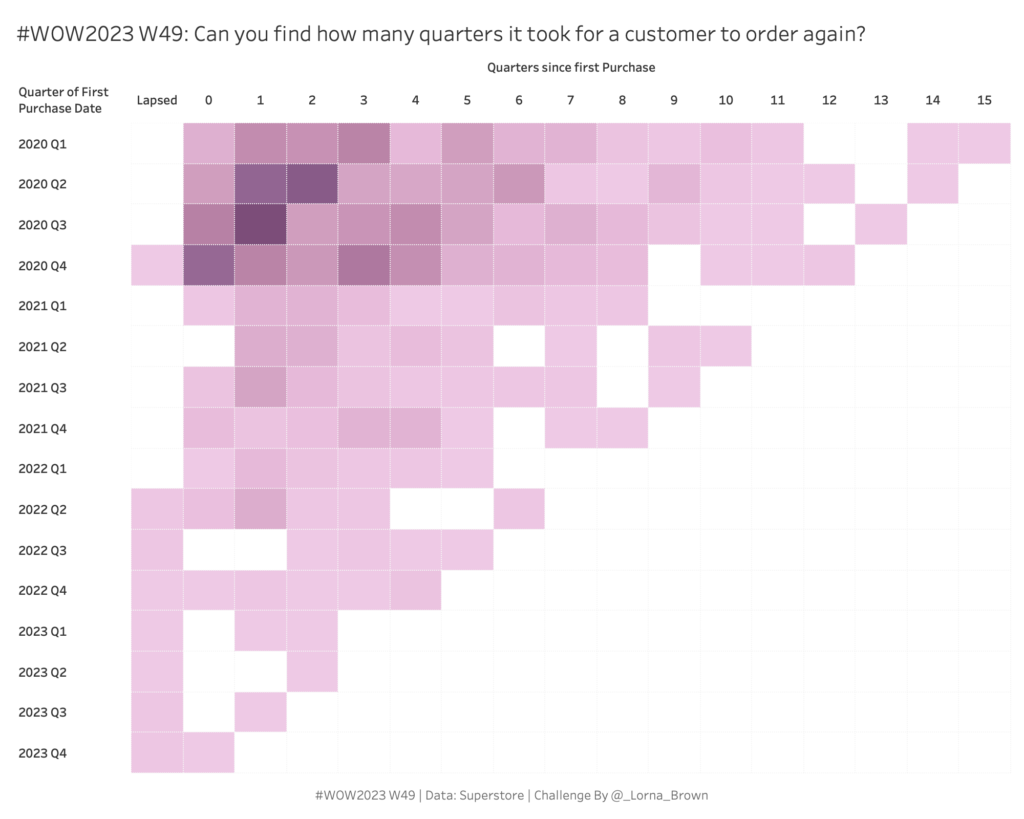
2023 W49: Can you find how many quarters it took for a customer to order again?

Introduction This week I wanted an easier challenge in the lead up to the Christmas Holidays. So what better way than doing some Level of Detail calculations. I want you to be able to find out how many quarters it took for a customer to make their second purchase Click to open in Tableau Public

2023 W49: Can you find how many quarters it took for a customer to order again? Read More »

Tableau, Workout Wednesday
ring chart

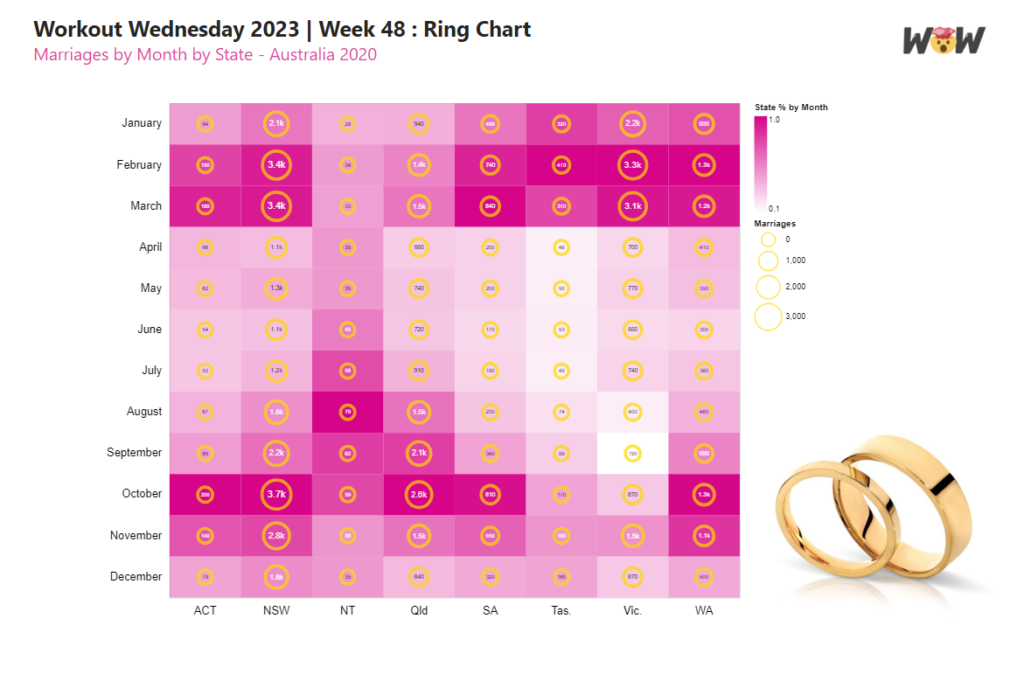
2023 Week 48 | Power BI: Ring Chart

Introduction This week’s challenge uses a few layering techniques in the Deneb custom visual. Here you will be challenged to use multiple independent scales on a layered plot. Advanced users can concatenate total bars for extra credit! Requirements Power Query Obtain the dataset from Github Model and load data Power BI Desktop Obtain Deneb from

2023 Week 48 | Power BI: Ring Chart Read More »

Power BI, Workout Wednesday