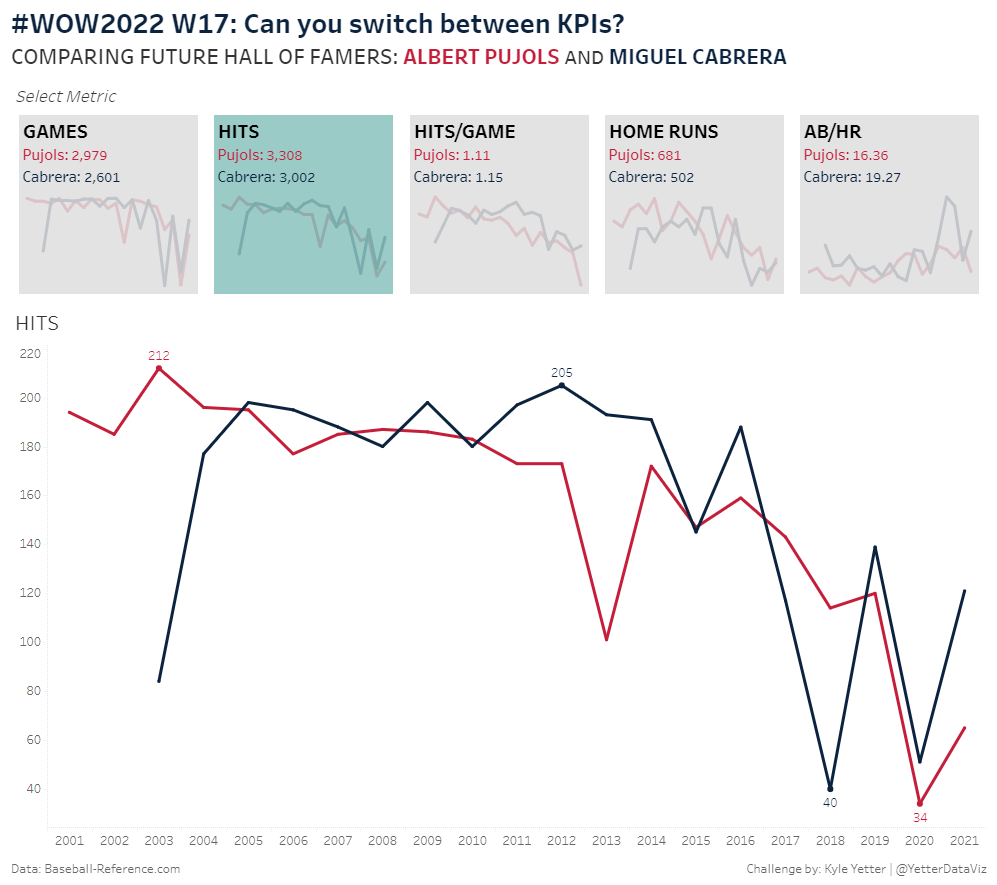
2022 Week 08 | Power BI: Can you make a Gantt Chart?

Introduction This week we are creating Gantt Charts in Power BI. It is not required to do all 4 variations, choose one of the options that interests you the most. Each option increases in time and/or experience level. Requirements QUICK MODE Import data Import the Microsoft Gantt Chart from AppSource Place Project Category in the

2022 Week 08 | Power BI: Can you make a Gantt Chart? Read More »

2022 Week 9: How many patients were admitted every 15 minutes?

Introduction This week we are going to look at hospital admission rates. This data source comes from The Medical Stays dashboard on the Tableau Exchange. This particular challenge is more focused on working with time than it is working with medical data. In this challenge you need to group time into 15 minute increments throughout

2022 Week 9: How many patients were admitted every 15 minutes? Read More »