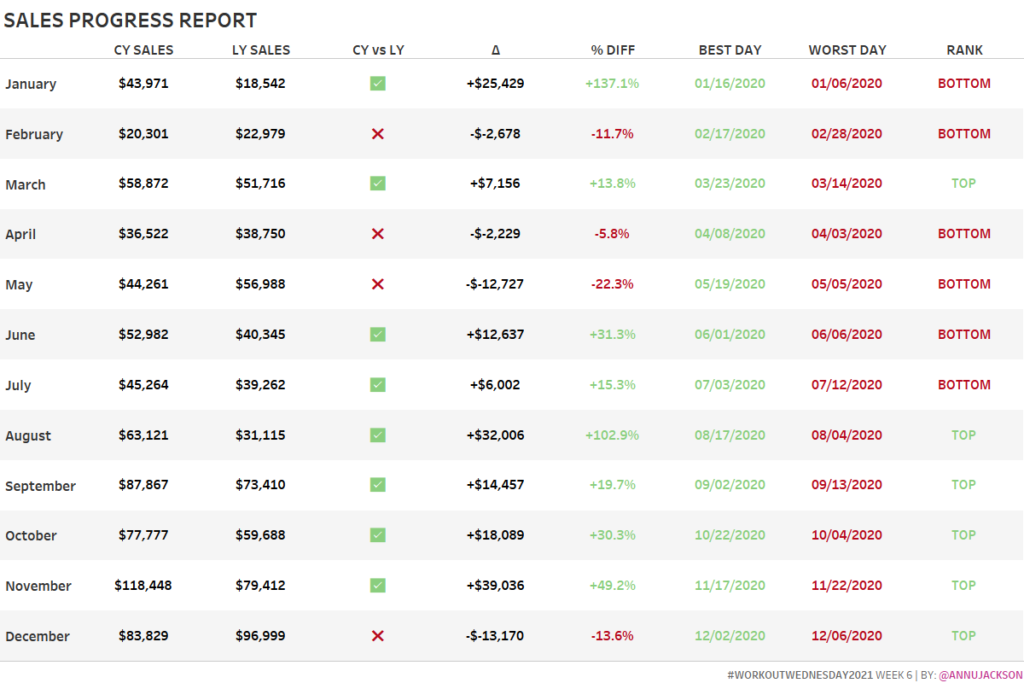
2021 Week 6 | Tableau: Can you build a Fancy Text Table?
Introduction This month I’ve decided to focus on something you’ve rarely ever seen from me – a good old fashioned text table. This challenge should be straightforward for users of all levels. And of course since I try to avoid plain text tables, this one has some fancy formatting thrown in for good measure. There […]
2021 Week 6 | Tableau: Can you build a Fancy Text Table? Read More »
Tableau, Workout Wednesday