Introduction
Happy TCish 2020! I can’t believe we’re already on week 41 of 2020 and in the midst of Tableau Conference. I don’t think any of the WOW team could have imagined that we would all be virtual and truly missing the company of the amazing Tableau community.
For this week, I wanted to do two things: tackle a situation you’ve likely encountered, and pay homage to some tips you’ve likely picked up from previous workouts.
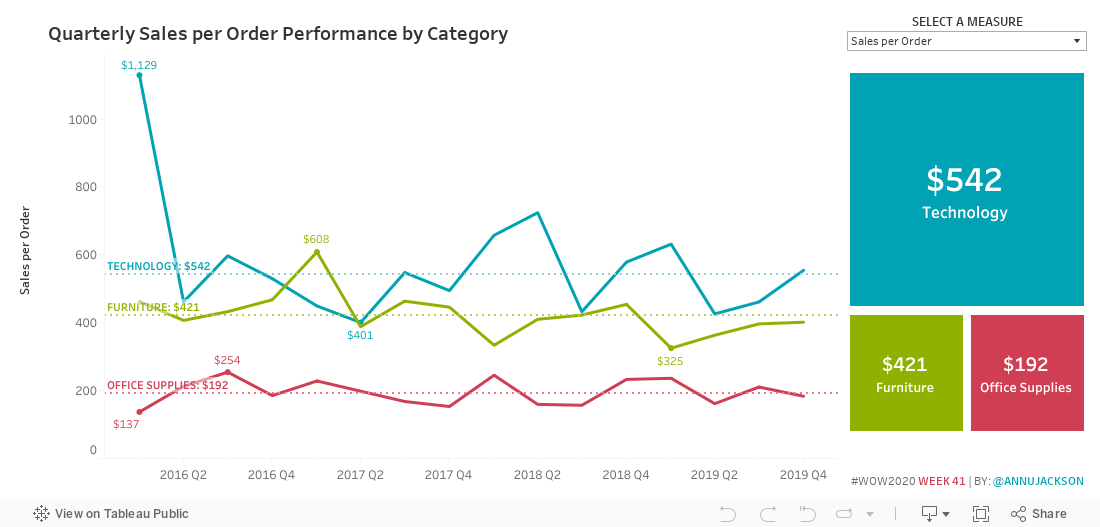
So the central situation for you this week – creating a reference line for each dimension on a line chart. This particular chart comes in handy when you want to compare overall aggregates or averages of each member of a dimension, but you want them on the same chart to see the relationship between them more clearly.
To make it more challenging, I’ve added in a requirement to flip between three different metrics, all which have different number formatting.
And then for even more fun, there’s a KPI section on the right that changes order depending on the rank of each category.
Requirements
- Dashboard Size: 1100px by 500 px
- # of Sheets – up to you (I am using 4 sheets)
- Create a quarterly line chart by category that toggles between 3 metrics
- Profit Ratio
- Sales per Order (Sales/Orders)
- Items per Order (Quantity/Orders)
- Quarterly line chart should have a reference line for each Category (Technology, Furniture, and Office Supplies). This should be a value that matches the KPI boxes aka an “overall” value.
- Create 3 KPI squares, that are rank ordered (top down, left to right). These should change order when you change metrics.
- Formatting
- Metric formatting should match for labels and KPIs based on selection
- Reference lines should match the color of the dimension and format of the metric.
- Don’t forget to have the rank in the tooltip of the KPI boxes.
- Line labels should be min/max (the GIF isn’t accurate, use Tableau Public viz as reference, thanks Andy!)
Default animations are also on!
Dataset
This week uses the superstore dataset for Tableau 2019.4. You can get it here at data.world
Attribute
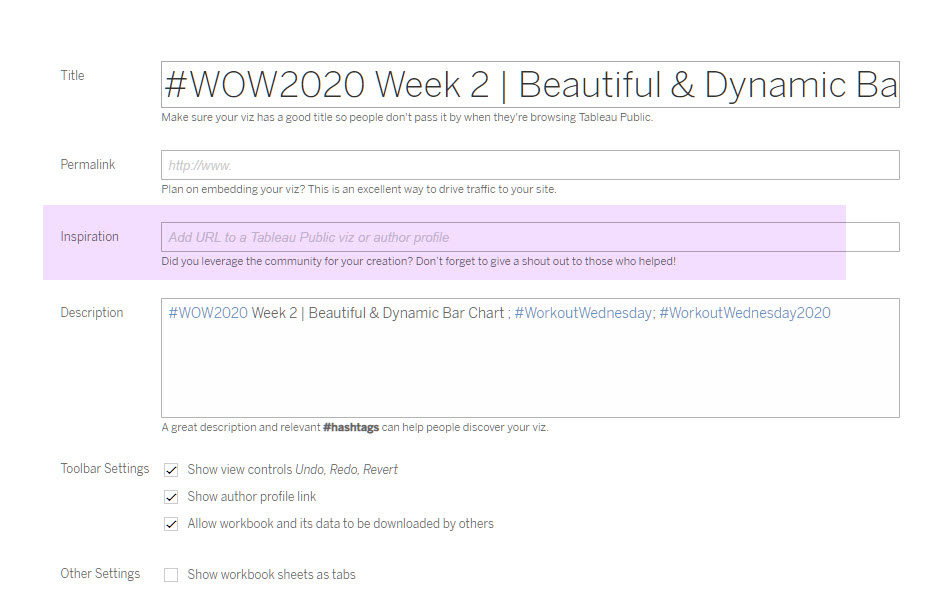
When you publish your solution on Tableau Public make sure to take the time and include a link to the original inspiration. Also include the hashtag #WOW2020 in your description to make it searchable!
Share
After you finish your workout, share on Twitter using the hashtag #WOW2020 and tag @AnnUJackson, @LukeStanke, @_Lorna_Brown and @HipsterVizNinja
Solution
Interactive