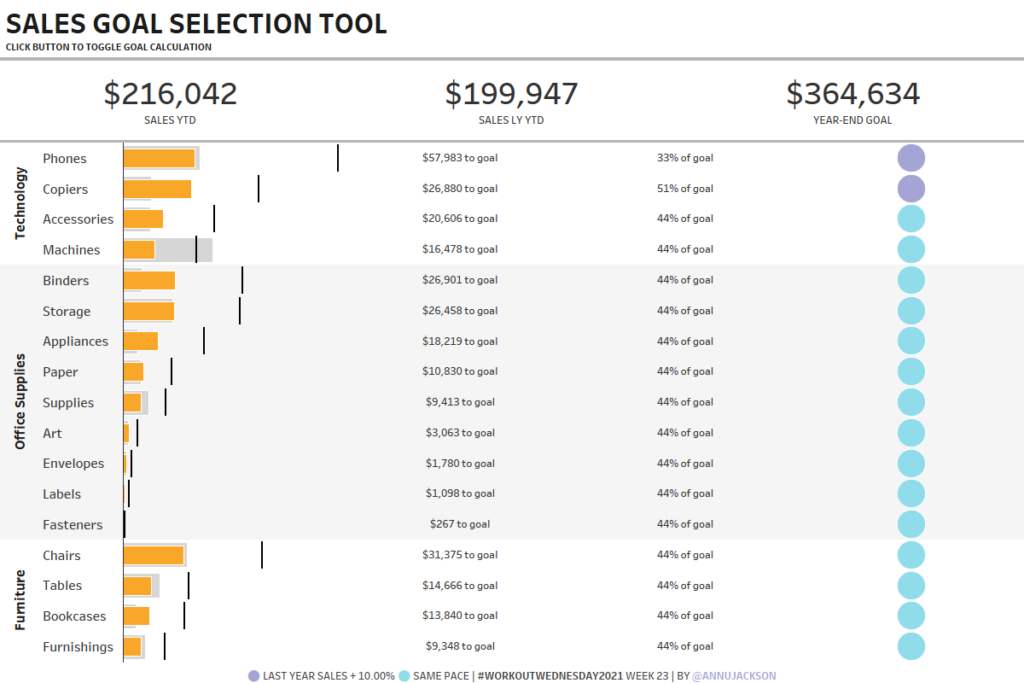
Week 17: Generation Population
When I came across Nathan Yau’s post, over on his site – Flowing Data, I instantly knew this would make a great #WorkoutWednesday challenge.
Week 17: Generation Population Read More »
When I came across Nathan Yau’s post, over on his site – Flowing Data, I instantly knew this would make a great #WorkoutWednesday challenge.
Week 17: Generation Population Read More »
Introduction With Tableau 2021.1 being released last month, I thought it was time for a challenge. This week we focus in on the new feature of Quick LODs. Click to open in Tableau Public Requirements Dashboard Size: 800px by 700 px One Sheet Create a dual axis chart which shows the Sub-Category Average Sales by
2021 Week 16 | Tableau : Can you use Quick LODs to recreate this view? Read More »
Power BI Conditional Formatting using Background Color, Font Color, and Icons
2021 Week 15 | Power BI: Bivariate Choropleth Map Read More »
Introduction Lately I’ve been working with Google Analytics data, so I thought I’d pass on a data set to you! Our data set was created by you the audience – it’s extracted directly from our website analytics. This week’s challenge focuses on a lot of little things coming together – dashboard design, formatting, and reference
2021 Week 15 | Tableau: Website Analytics Read More »
Power BI Conditional Formatting using Background Color, Font Color, and Icons
2021 Week 14 | Power BI: Accessibility Enhancements Read More »
Introduction Have you ever purchased something on Amazon and they show an extra random list of products in the “Customers that purchased X also purchased…” section and you think to yourself, “How in the world did they come up with that combination (e.g., sponges and Skittles)?” They likely have high-powered recommender engines doing all of
2021 Week 14 | Tableau: Can You Recommend Profitable Return Customer Bundles? Read More »
Introduction The goal is a modified mekko chart. My guess is you will need LODs to solve but it is 100% possible with table calculations. Click to open in Tableau Public Requirements Dashboard Size: 800px by 400 px Set the bar height to be percent profitable. The level of analysis should be at the sub-category
2021 Week 13 | Tableau: What percentage of sub-orders are profitable? Read More »
Power BI Conditional Formatting using Background Color, Font Color, and Icons
2021 Week 13 | Power BI: Create a Bubble Chart with a Custom Overlay Read More »
The Fixed LOD gets a lot of the spotlight in tableau but we shouldn’t forget about its cousins INCLUDE & EXCLUDE. Have a go at this challenge to practice use those functions.
Week 12: Can you do Comparative Quantity Analysis? Read More »
Power BI Conditional Formatting using Background Color, Font Color, and Icons
2021 Week 11 | Power BI: Can you Turn a Ribbon Chart into a Bump Chart? Read More »