Workout Wednesday

2024 Week 4 | Power BI: Recreate this weather visual with overlapping columns

Introduction I keep seeing a particular visual shared by a Denver-area meteorologist on social media. It seems to be output from weathermodels.com.  I thought it might be fun to make a modified version in Power BI, so that is our challenge this week. While we don’t have native overlapping columns, there is a native solution […]

2024 Week 4 | Power BI: Recreate this weather visual with overlapping columns Read More »

Power BI, Workout Wednesday

#WOW2024 | Week 4 | Can You Create Donut Charts Exceeding 100%?

Introduction I am honored to join as a new contributor starting from 2024. I have gained immense skills and motivation from the Tableau community, including Workout Wednesday.As a way to give back to the community, I am committed to providing valuable and enjoyable challenges! Now, let me introduce a challenge about donut charts that I

#WOW2024 | Week 4 | Can You Create Donut Charts Exceeding 100%? Read More »

Tableau, Workout Wednesday

2024 Week 3 | Power BI: Back to basics with a bar chart

Introduction Welcome back to Workout Wednesday! We’re taking it back to basics this week and creating a bar chart that uses small multiples and conditional formatting. We’re using the #MakeoverMonday team’s data on New Year’s Resolutions and the design is inspired by a Makeover Monday participant! A huge thank you to Ela Piwowarska for creating her submission and

2024 Week 3 | Power BI: Back to basics with a bar chart Read More »

Power BI, Workout Wednesday

2024 Week 03 – Double bar amount by accounts

Introduction 2024 is here! And with that, a completely new set of challenges for you, data lover.  Let’s sharpen our CRMA skills with this challenge: A double bar chart displaying open and closed amounts by account. The closed amount should display won and lost amounts in a single stacked bar. The open amount should be

2024 Week 03 – Double bar amount by accounts Read More »

CRM Analytics, Workout Wednesday
#WOW2024 | Week 3 | Can you dynamically zoom into a clustered area?

Introduction This week I wanted to test out one of Tableau’s new features, Dynamic Axis Ranges. In this exercise you want to be able to zoom into some of those clustered countries which you can then hover over to get more information about. There are, of course, some other features within this visualisation. You might

#WOW2024 | Week 3 | Can you dynamically zoom into a clustered area? Read More »

Tableau, Workout Wednesday

2024 Week 02 – Text Clustering in Einstein Discovery

Introduction Welcome to Week 2 of the 2024 CRMA Workout Wednesday challenge.  This week we will be working with Text Clustering in Einstein Discovery Models.  Text Clustering, sometimes called Mining or Data Mining, is the function of analyzing unstructured data to group similar context or pieces of text into categories or… clusters.   Often times our

2024 Week 02 – Text Clustering in Einstein Discovery Read More »

CRM Analytics, Workout Wednesday
2024 Week 2 | Power BI: Soda Pop Sales in a Jittered Column Chart

Introduction This week we have our first guest post of 2024! Today’s challenge comes from Imran Haq (LinkedIn, X). I have always admired his Deneb skills, so I’m excited to share this report with you today. We are making a jittered column chart with Deneb. The theme of soda (or pop, coke, or whatever you

2024 Week 2 | Power BI: Soda Pop Sales in a Jittered Column Chart Read More »

Power BI, Workout Wednesday

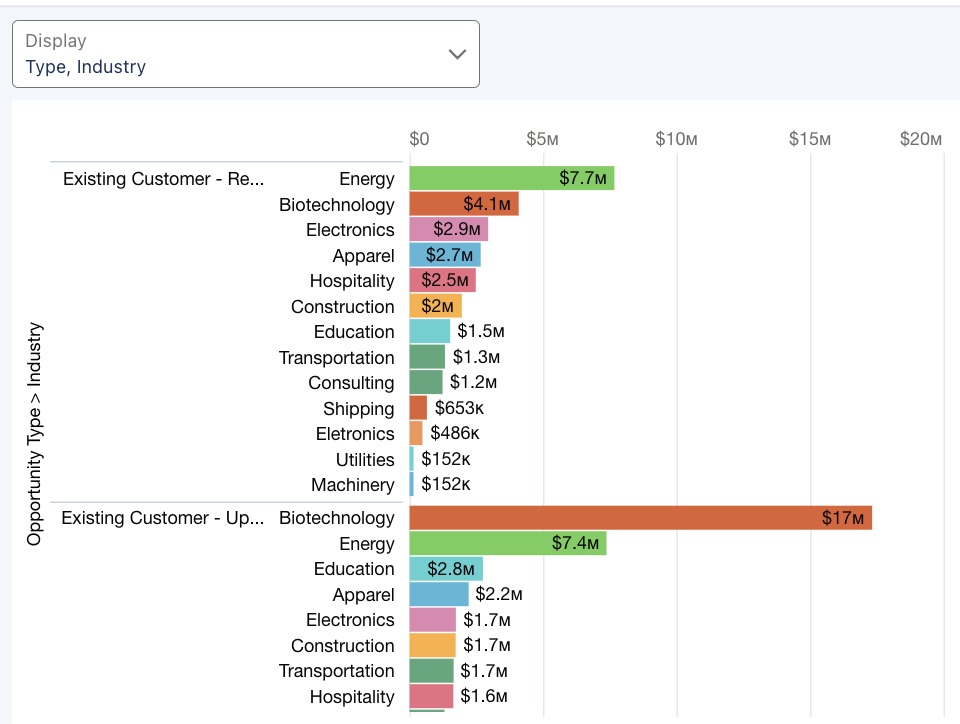
2024 Week 2 | Sigma: Can you recreate this drillable bar chart?

Introduction Let’s keep the new year rolling! I’m Eric, and I’m really excited to host this week. Thanks to all the folks who have participated so far, we look forward to seeing more of your submissions this week. Today, I’m excited to give you a challenge that gets you familiar with drilling in Sigma. Let’s

2024 Week 2 | Sigma: Can you recreate this drillable bar chart? Read More »

Sigma, Workout Wednesday