2024 Week 30 | Power BI: SVG Filters
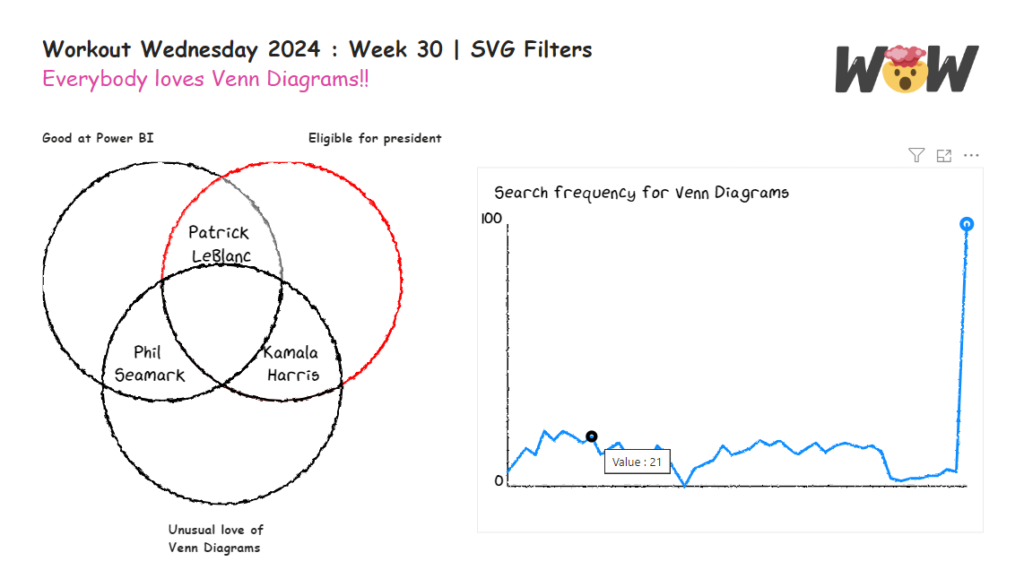
Introduction This week’s challenge was inspired by an XKCD comic and Kamala Harris’ love of Venn diagrams. Leveraging a prior challenge by Phil Seamark, this challenge we are going to apply SVG filters to make the shapes appear hand drawn XKCD style, and import XKCD font via the HTML content visual. XKCD font can be […]
2024 Week 30 | Power BI: SVG Filters Read More »
Power BI, Workout Wednesday