#WOW2024 | week 30 | Connected Scatterplots
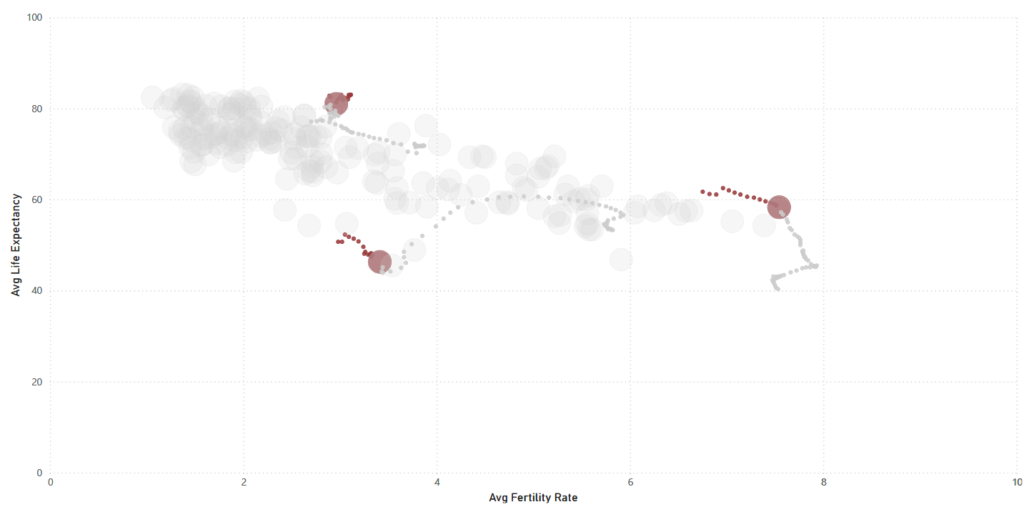
Introduction It’s no surprise that many analysts tend to enjoy looking at data via a scatterplot. It’s a great way to show correlation across two measures for a cohort of dimensions. Additionally, one of the most popular charts of all-time is a line chart which shows historical trends. So how we do show correlation of […]
#WOW2024 | week 30 | Connected Scatterplots Read More »