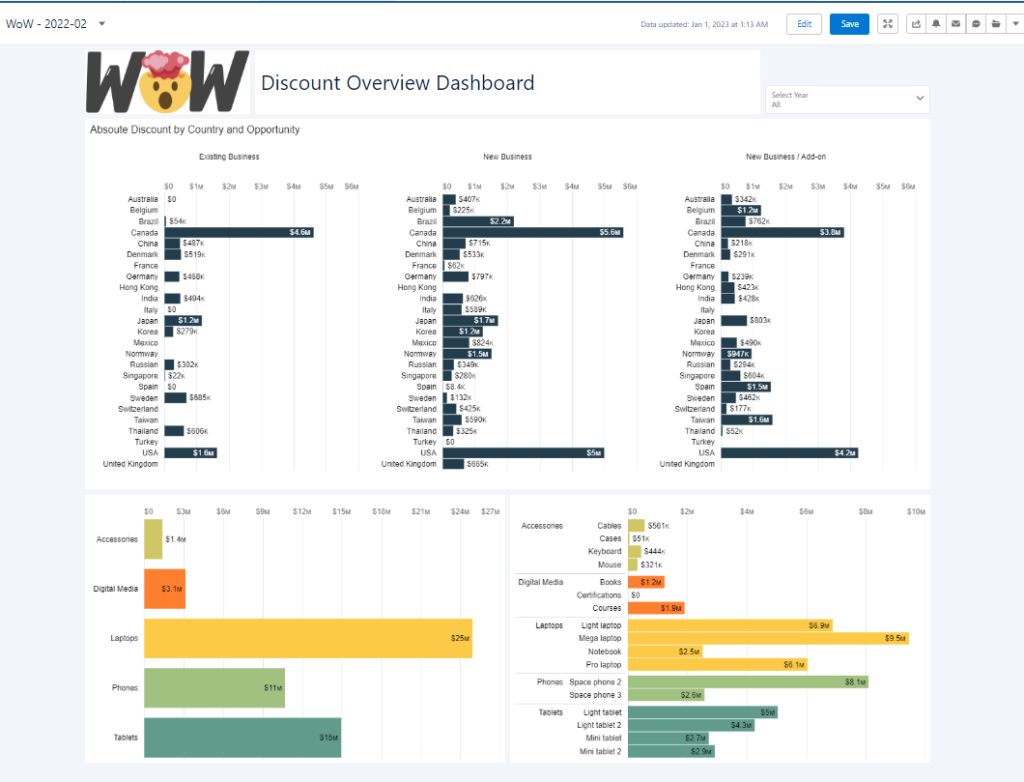
2023 Week 03 | Interactive Discount Dashboard
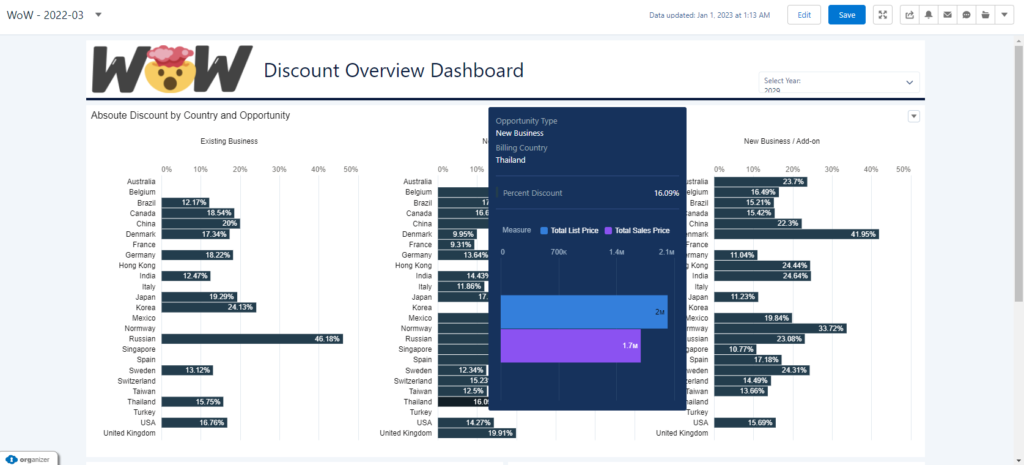
Introduction This week we will continue working on our dashboard from last week. We’ll improve the design a little bit and work on the interactivity to provide more information and guide the user through the dashboard. Requirements Make the header a solid white box with a a solid line below (same colour as the first […]
2023 Week 03 | Interactive Discount Dashboard Read More »