
The goal of this challenge is to create a workbook with a single visual page. This page will contain one chart and one control. The end user can use the control to select which dimension they want to display and then click into the chart to get more detail about that item
Hidden Data Sheet
On this sheet, all we need is a table containing our base data: RETAIL/PLUGS_ELECTRONICS/PLUGS_ELECTRONICS_HANDS_ON_LAB_DATA
In this base data table, we will need to do some transformations:
- Grouping by “Selected Grouping”: Create a segmented control that lets users select between Products, Stores, and Customers. Then create a calculated column that finds the appropriate Name and/or Key.
- Calculated columns:
- Customer Key – Name: While Store Name and Product Name should be unique, there are multiples in our Customer Name column. We need a column that combines these 2 columns, so we can appropriate aggregate our Value List
- Grouped Profit: Use the Profit Metric
- Filter to show the Top 10
- 3 Boolean columns that determine if the row’s Product/Store/Customer matches the selected one in the hidden controls for the matching Single Value Container. You will use these to filter charts on your Details Modals
- Hint: While you cannot see these controls, the naming convention is [<source-name>-single-row-control]. You will see the control icon in the formula bar suggestions i.e.
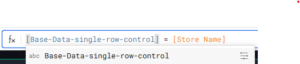
- Hint: While you cannot see these controls, the naming convention is [<source-name>-single-row-control]. You will see the control icon in the formula bar suggestions i.e.
- Extract columns from the Customer JSON to get more detail about the row’s customer.
Visible Page:
Your visible page should contain:
- A single chart that shows the Top 10 most profitable Selected Grouping & Store Region
- Your segmented control that lets users select that grouping
Modals: Product / Store / Customer Details
For each possible grouping selection, create a single row container modal. These modals should contain:
- A Value List containing pertinent information about the selected value
- A visualization like KPI chart or Map
Finishing Touches
- Give your visible page a descriptive title
- Arrange your elements into a cohesive dashboard
- Update your workbook’s settings to give it a more personalized flair
Food for thought
- What else could you utilize a Single Row View or Value List for?
Tips
- When you make your Boolean columns, be sure to test the values first, so you can be sure you’re referencing the right one