2025 Week 37 | Sigma : Can you picture this in your data?
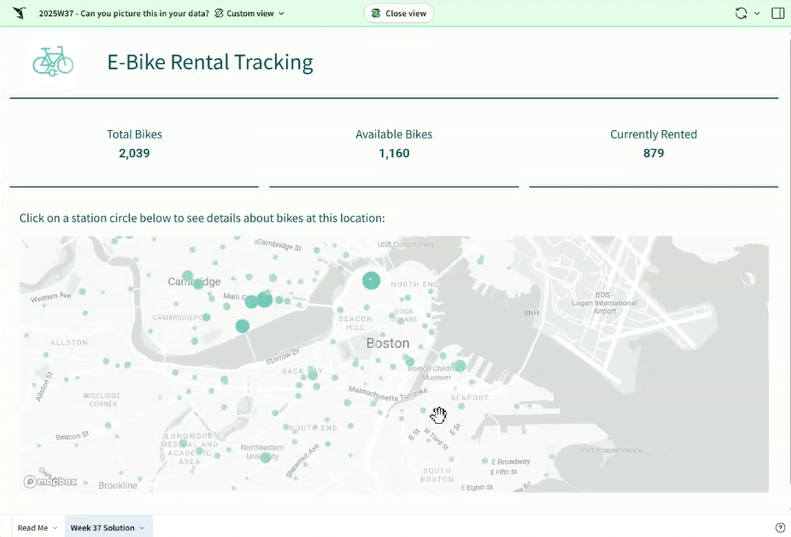
Introduction Welcome to Week 37 of 2025! Numbers tell the story, but sometimes a picture says it faster. This week we’re charging up our Sigma skills by adding images into table cells and playing with maps. You’ll learn how to make your tables more visual, show dynamic elements like battery levels or icons, and bring […]
2025 Week 37 | Sigma : Can you picture this in your data? Read More »