Introduction
This week we are looking at some newer core visuals and formatting features: cards that in a segmented tile layout, a slicer that supports partial text matching, and a matrix where the percentage-of-total calculation changes meaning depending on whether you’re looking at a subtotal or a detail row.
The bonus challenge pushes into SVG-in-DAX territory, using dynamic data bars and pill badges to visually distinguish country subtotals from product detail rows — all within a single matrix column.
Dataset
Requirements
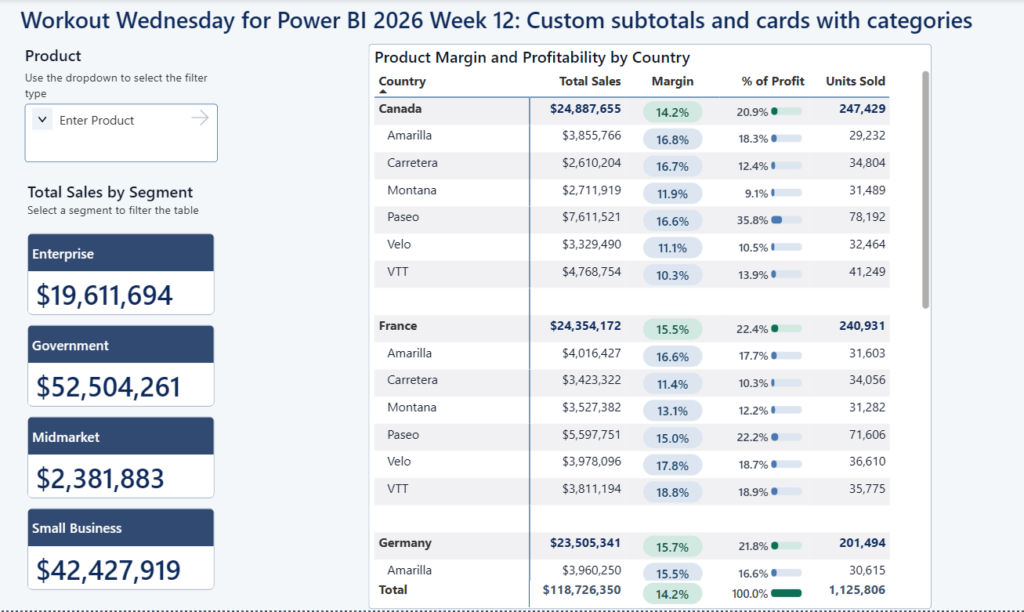
- Create cards that show Total Sales by Segment in a tile layout. Display one tile per segment. Each card should show the segment name as a category label and the total sales value as the primary metric. Arrange the cards vertically in a stack as shown in the example. The cards should cross-filter the matrix on the page.
- Create a Product slicer that supports multi-select and partial text search. Use a slicer configured so users can type part of a product name to filter the list (not a dropdown). The slicer must also allow selecting multiple values simultaneously. Selections should filter both the cards and the matrix.
Build a matrix showing Product Margin and Profitability by Country. The matrix rows should be Country (as the first level) with Product nested beneath each country. Include these four value columns:
- Total Sales: sum of sales formatted as currency.
- Margin: profit margin percentage ((Sales – COGS) / Sales), displayed as a percentage.
- % of Profit: At the country subtotal level, this should show the country’s profit as a percentage of all countries’ total profit (i.e., its share of the grand total). At the product row level within a country, it should show the product’s profit as a percentage of that country’s profit only.
- Units Sold — sum of units.
⭐ Bonus points:
Add SVG-based data bars and pill badges to the Margin column of the matrix. Country subtotal rows should render a pill badge with a distinct background color; product rows within a country should render a data bar.
This challenge uses the Financial Sample dataset built into Power BI Desktop. To load it, open Power BI Desktop, go to Home → Try a sample semantic model (or File → New → Try a sample semantic model), and select Financial Sample. The dataset contains one table called financials with columns including Country, Product, Segment, Sales, COGS, Units Sold, and others.
Alternatively, you can download the Excel file directly from Microsoft and import it.
Share
After you finish your workout, share on BlueSky or LinkedIn using the hashtags #WOW2026 and #PowerBI, and tag @MMarie, @shan_gsd, @KerryKolosko (on BlueSky).