Month: February 2022

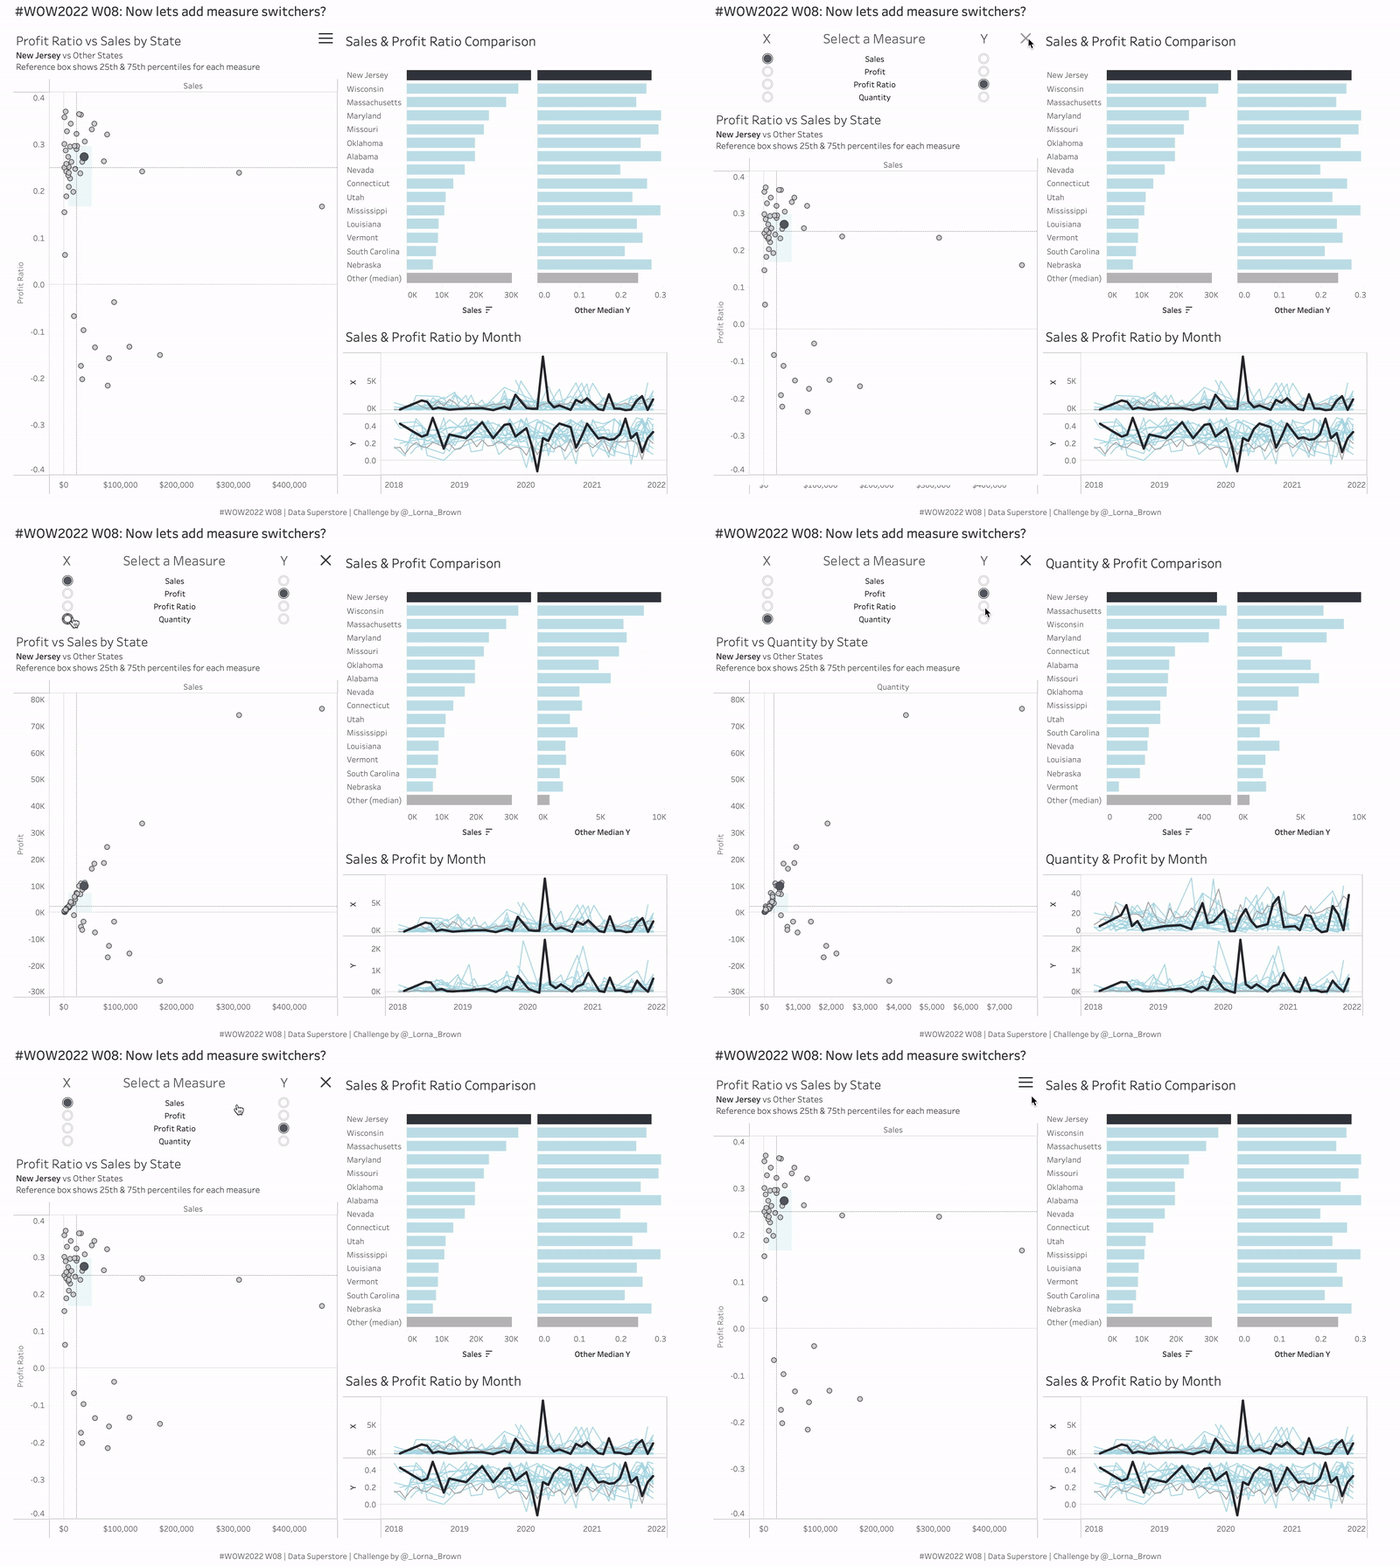
#WOW2022 | Week 08 | Let’s switch those measures!

Introduction There has been an overwhelming response from the last couple of weeks series so I thought, let’s continue. How many times have you gone into a meeting with a finished dashboard and someone’s asked “Can you just…”. Well here is my “Can you just…”!! I want you to be able to switch what measures …

#WOW2022 | Week 08 | Let’s switch those measures! Read More

Power BI Parallel Sets

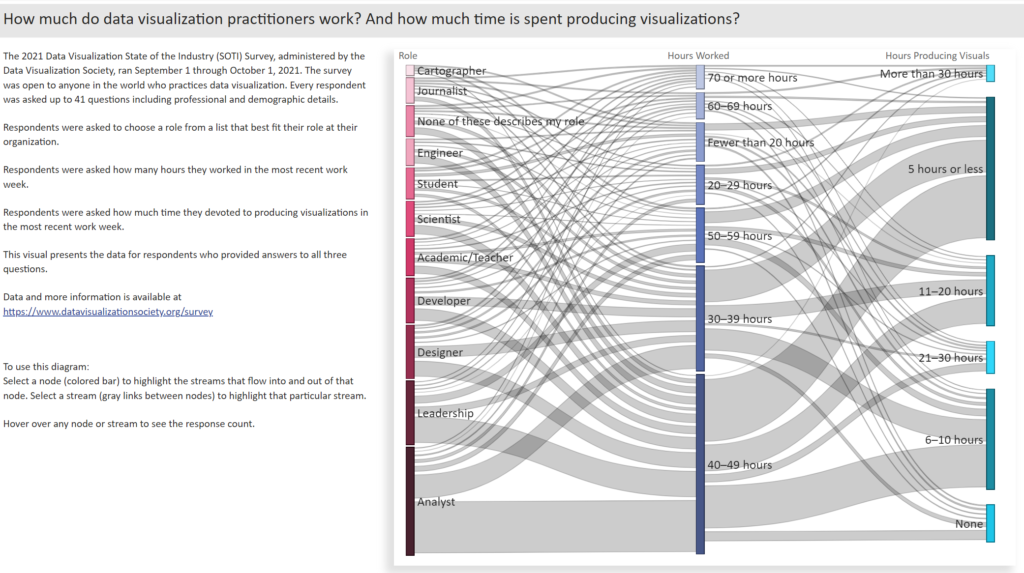
2022 Week 07 | Power BI: Parallel Sets

Introduction Welcome to week 7 of Workout Wednesday for Power BI 2022. We are again using the Data Visualization Society‘s annual State of the Industry survey results.  This week we are looking at how we can visualize parallel sets. Although this may not be a visual that we use often, it can be very useful for multivariate analysis. …

2022 Week 07 | Power BI: Parallel Sets Read More

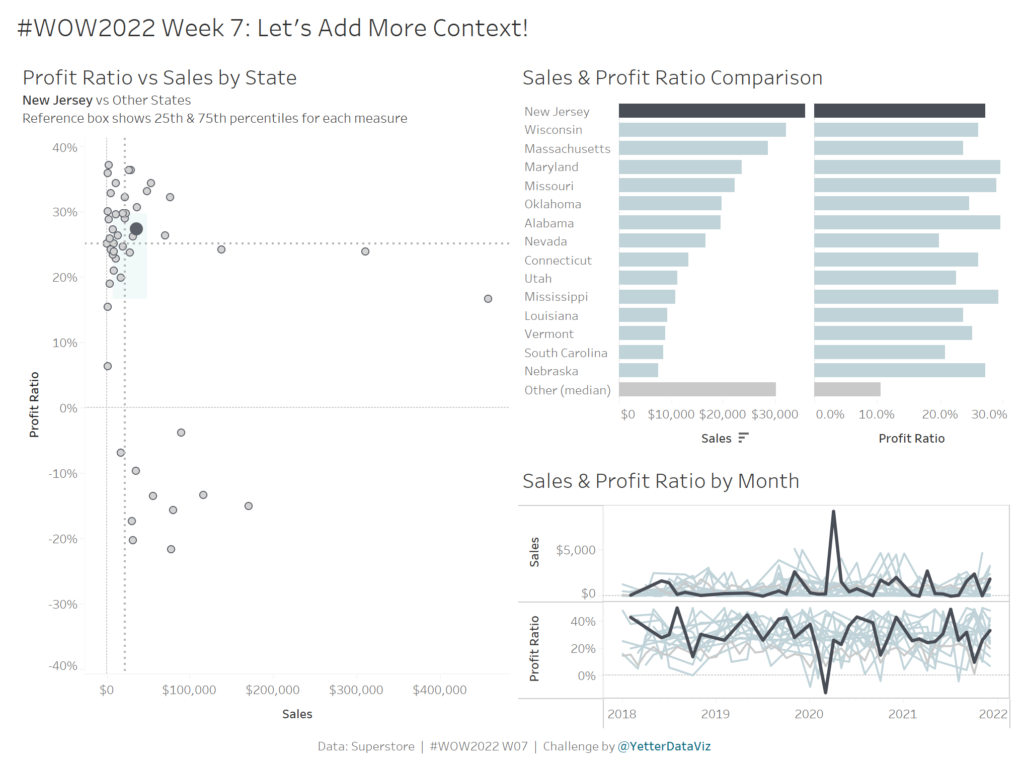
#WOW2022 | Week 07 | Adding More Detail & Context

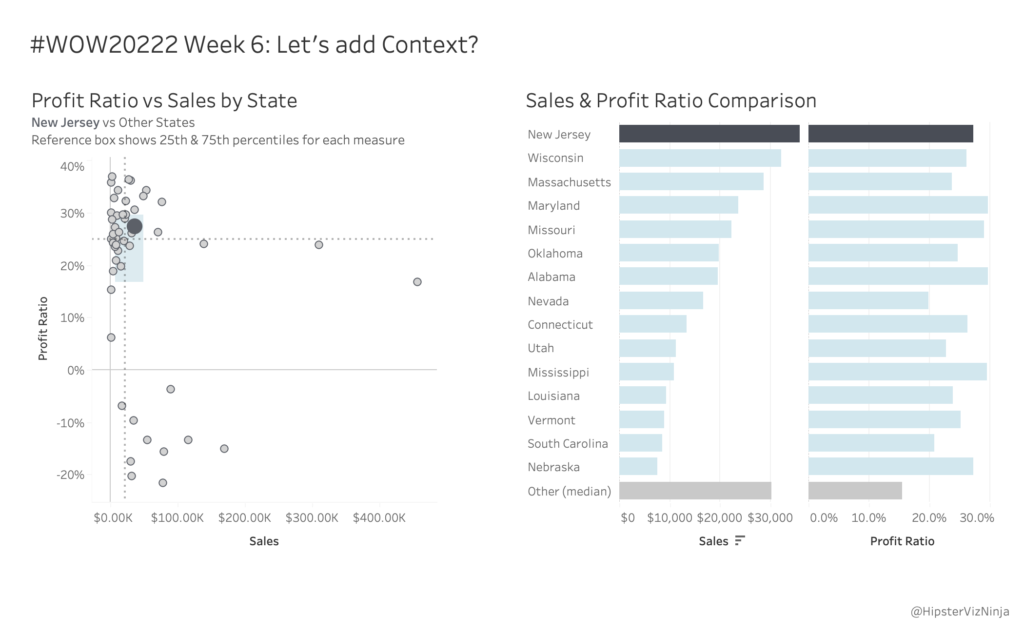
Introduction This week is our third installment of this month’s “dashboard series” so we’ll be building upon Erica’s challenge from Week 5 and Sean’s challenge from Week 6. If you’ve done Week 6, you can start from that, or you can check out those challenges linked above and come back to this when you’re done…or …

#WOW2022 | Week 07 | Adding More Detail & Context Read More

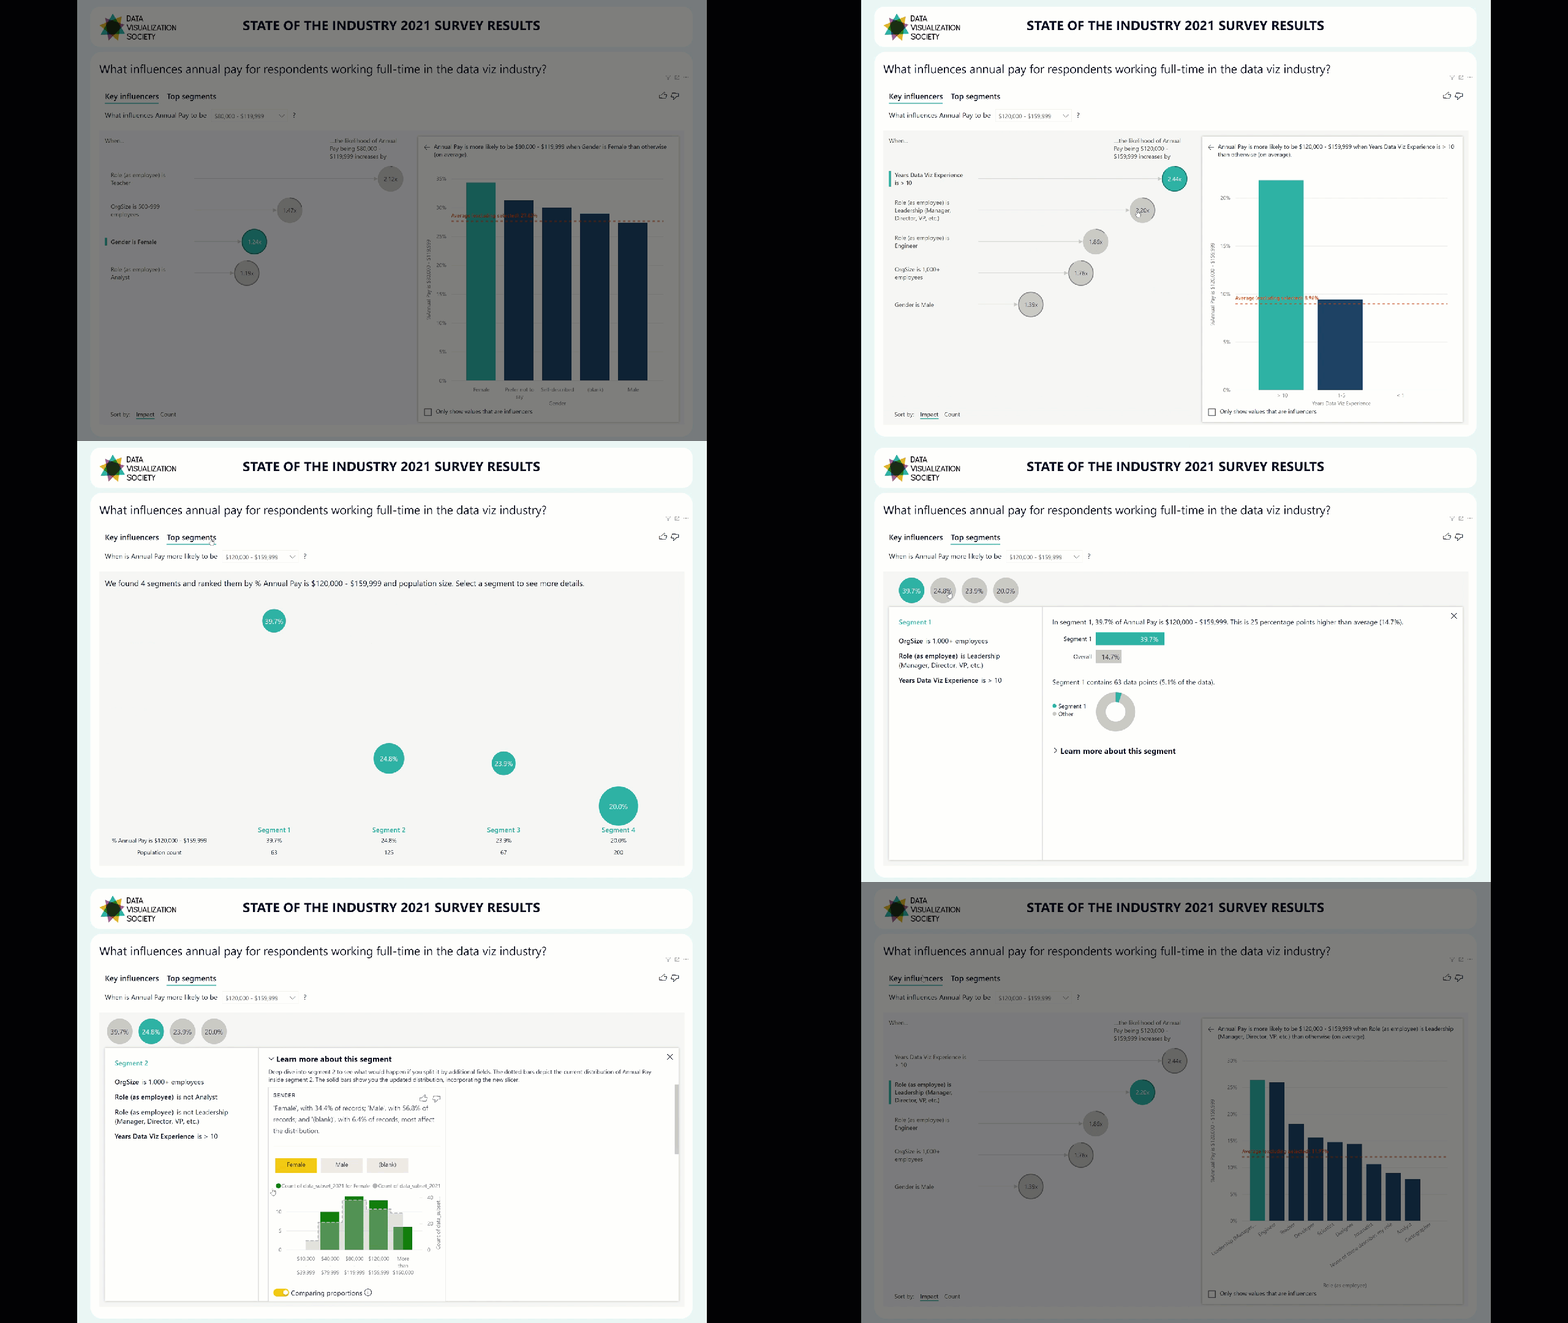
2022 Week 06 | Power BI: Key Influencers

Introduction Welcome back to Power BI #WorkoutWednesday – we’re now in week 6! If you’re joining us for the first time, welcome! There are no dependencies on previous weeks – you’re welcome to jump right in with this week’s challenge, where we’ll use AI in Power BI to get an understanding of key influencers of …

2022 Week 06 | Power BI: Key Influencers Read More

Week 05 2022 Challenge

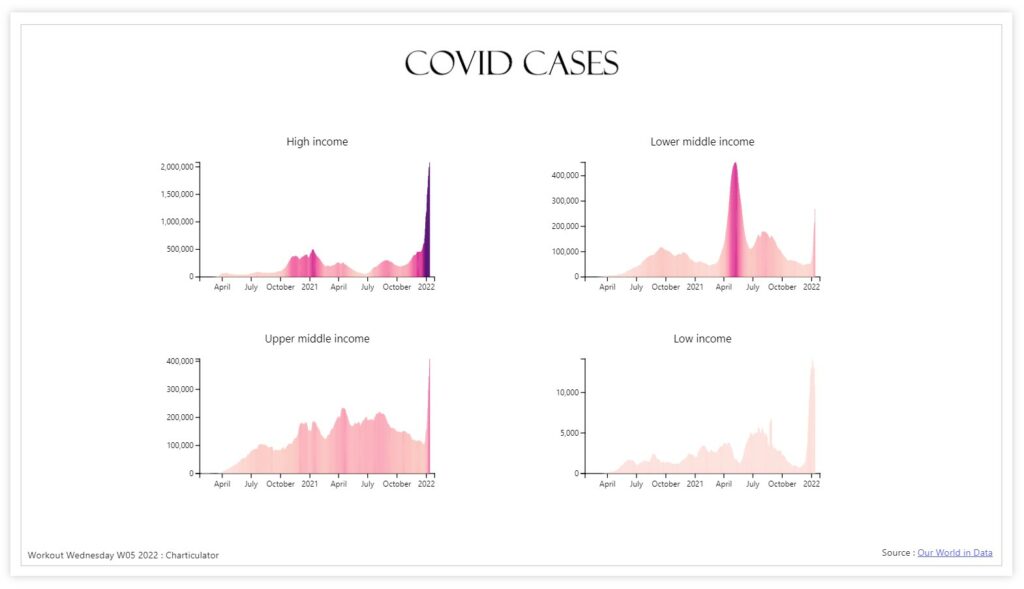
2022 Week 05 | Power BI: Can you make a Nested Chart with Charticulator?

Introduction This week we are familiarising ourselves with Charticulator and Nested Charts. This graph was inspired by Gus Wezerek and Sara Chodosh’s chart for NYT Opinion. Requirements Download the data and remove all columns excepting the Date field, New Cases Smoothed Field and Location (save as csv) Create a second csv with only Location = …

2022 Week 05 | Power BI: Can you make a Nested Chart with Charticulator? Read More

Scatter Chart

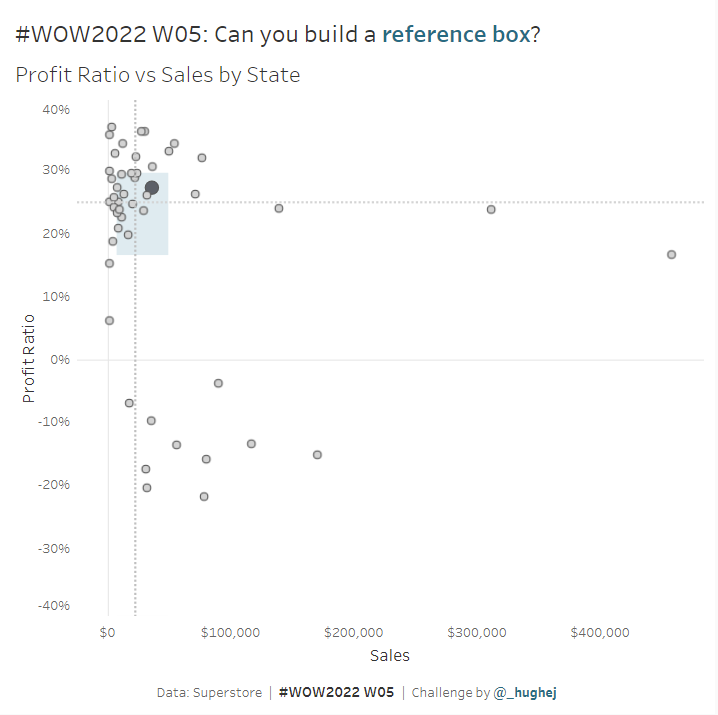
#WOW2022 | Week 05 | Can you build a reference box?

Introduction This week is my debut challenge as a Workout Wednesday coach and it’s safe to say that I’m looking forward to the year ahead! All the coaches are teaming up this month to bring together an interactive dashboard made up of challenging charts. Over the next few weeks, each coach will contribute one piece …

#WOW2022 | Week 05 | Can you build a reference box? Read More

Scroll to Top