
December 2019

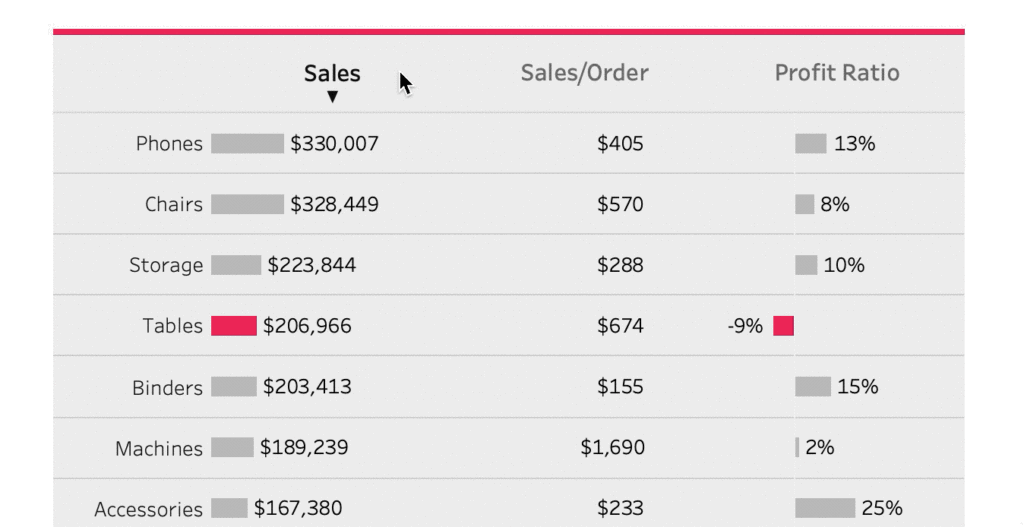
Week 1: Can you sort dimensions with a single click?

Introduction We’re back in 2020 with a whole new set of challenges. This month you’ll see challenges from Lorna, Ann, Sean, and myself. I’m starting this year off with a bar chart/data table because in our day-to-day we are always looking for a way to spice up our charts.  To spice up these charts we […]

Week 1: Can you sort dimensions with a single click? Read More »

Tableau, Workout Wednesday
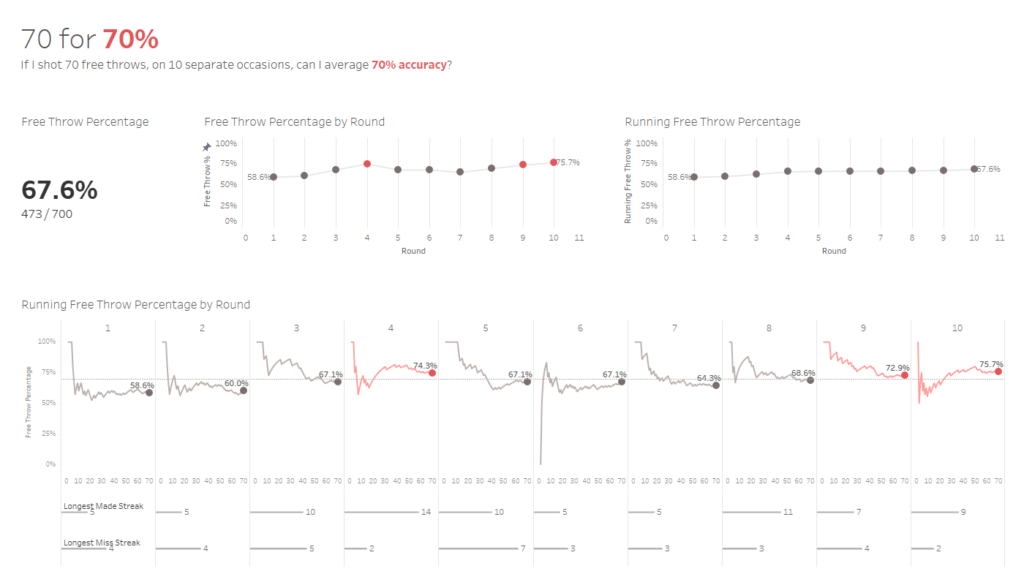
2019 Week 52: Can you visualize ones and zeros?

I feel completely honored to have spent a year working with Ann, Lorna, and Luke on this amazing project. I truly believe that Workout Wednesday is simply one of the best ways to skill up in Tableau, and if you regularly participate, you’ll quickly find yourself surpassing others in your profession and setting yourself apart

2019 Week 52: Can you visualize ones and zeros? Read More »

Tableau, Workout Wednesday
Workout Wednesday: Where we are and where we are headed in 2020

Twenty-nineteen is nearly in the books! This year we produced fifty-two fantastic challenges with varying degrees of difficulty. None of these challenges could have been successful without your participation! Regardless of difficulty we focused the challenges on learning particular tips or tricks from the tool. Along the way we’ve seen the community grow and evolve

Workout Wednesday: Where we are and where we are headed in 2020 Read More »

Uncategorized

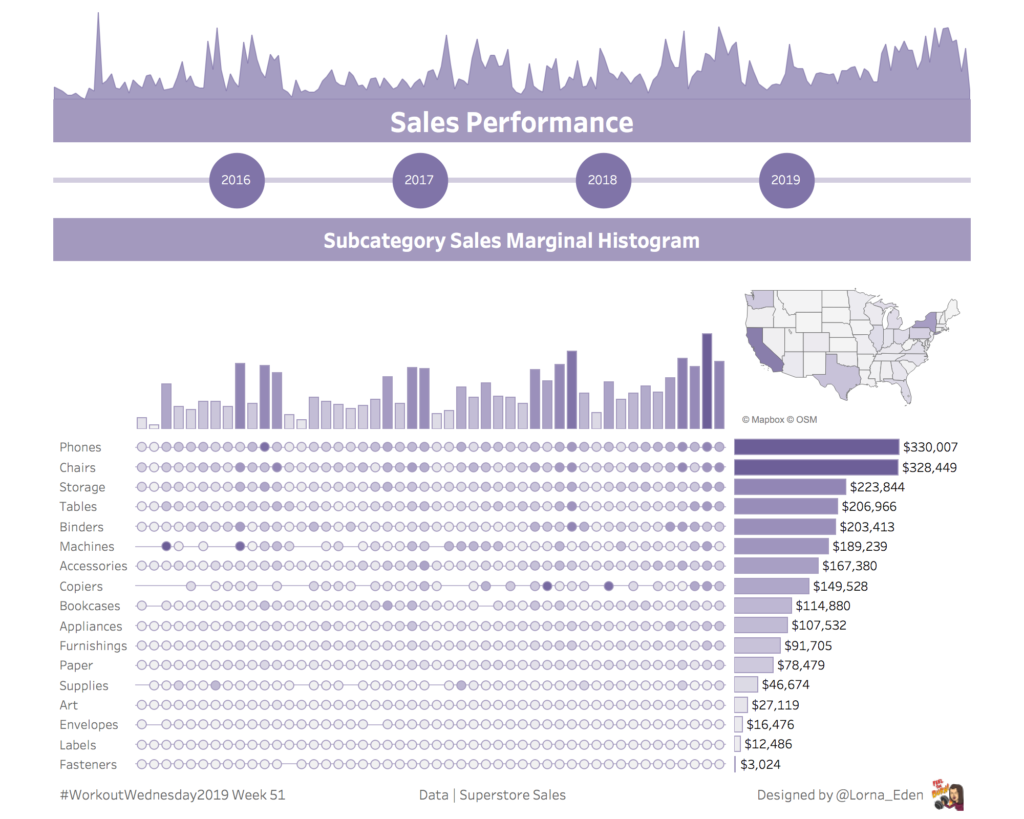
#WorkoutWednesday2019 Week 51 – Sales Performance Dashboard

I thought I would end the year with a simple Sales Performance dashboard. It is a recreation from Pradeep Kumar G‘s viz. What I love about this viz is how simplistic it looks and sticking with a “Brand”. This week, we create something similar, keeping it simplistic and on “Brand” Requirements Dashboard 1000 x 800

#WorkoutWednesday2019 Week 51 – Sales Performance Dashboard Read More »

Tableau, Workout Wednesday
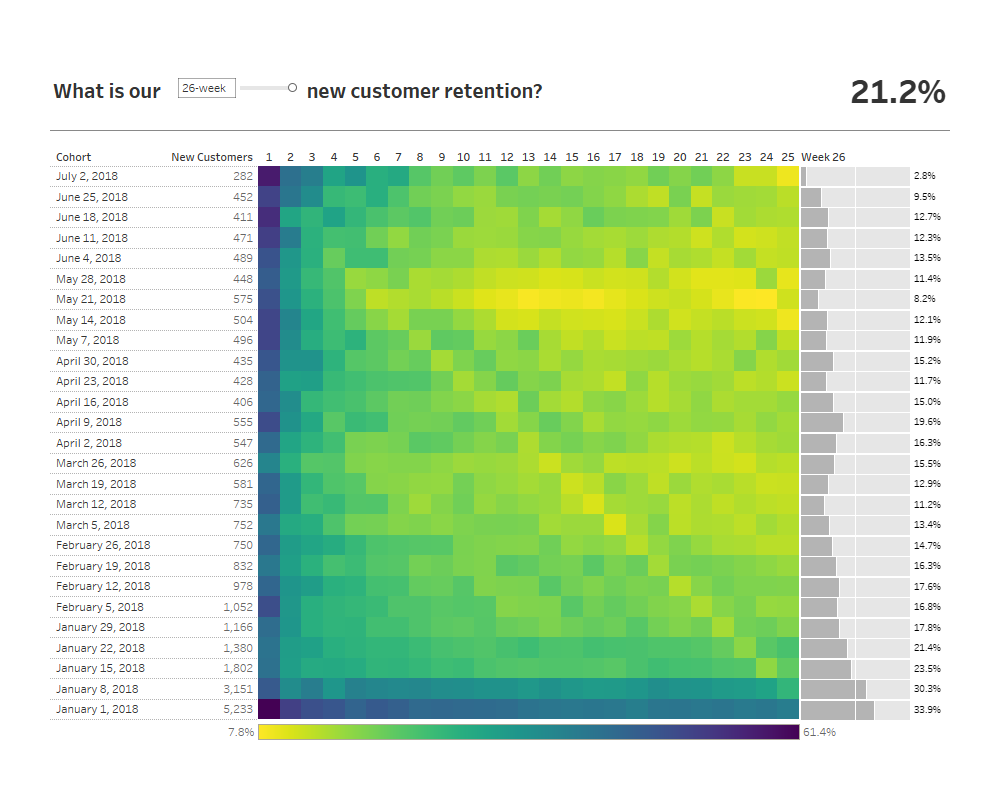
2019 Week 50: Can you build a retention heat map with a marginal histogram?

Let’s take a break from Superstore this week! I’ve fabricated some new data that will help us create a more realistic view of customer retention, you can connect to the data via the Google Sheet connector at this link. This data set has one row per order week and customer ID, representing said customer placed

2019 Week 50: Can you build a retention heat map with a marginal histogram? Read More »

Tableau, Workout Wednesday