Workout Wednesday in August
August is community submission month. For all 5 of those weeks we’ll have our favorite submissions as challenges. You can submit here.
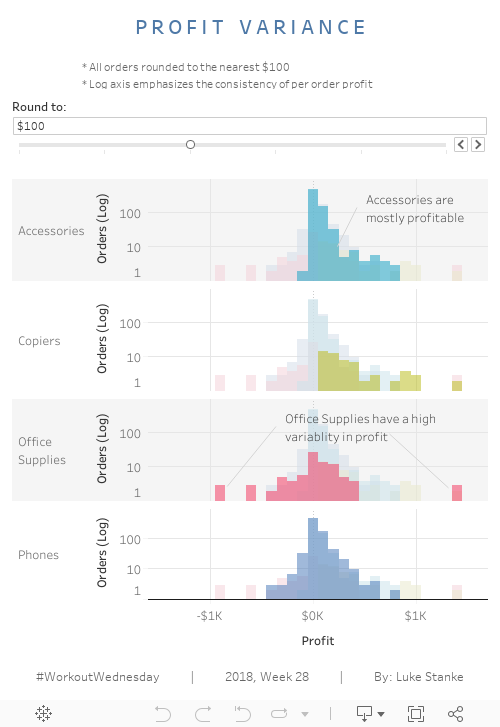
This week’s challenge.
Sometimes we want to look at the spread of our data, but we often end up with one or two groups that much, much higher levels. This often leaves us with many bars that are very small. In these cases – specifically cases where we want to emphasize the smaller values – I like to use a log axis. This week we’ll take a look at log axes by looking at the variability in per-order profits by sub-category.

Requirements
- Dashboard size is 500 x 700; tiled; 4 sheets
- Use the superstore dataset. Focus on the Sub-category of the “Technology” category.
- Show profit per order on the columns (x-axis).
- Use a parameter to round the profit to the nearest $25, $50, $100, $250, $500, or $1000.
- Show distinct count of orders on the rows (y-axis). Set your axis to run from 0 to 999.
- Set the axis to be log.
- Make sure to assign the highlight color to each sub-category.
- Filter to orders with profits from -1500 through 1500.
- Create bars and center them on the appropriate value. Set the width of the bar to the rounded value.
- Add annotations so they only show when $100 is selected on the parameter.
- Set the height of the Accessories, Copiers, and Office Supplies to 110 pixels. Set Phones to 160 pixels.
- Match color, tooltips, and formatting. I’ll be paying attention to all parts.
Dataset
This week uses the superstore dataset for Tableau 2018.1. You can get it here at data.world
Share
After you finish your workout, share on Twitter using the hashtag #WorkoutWednesday and tag @AnnUJackson, @LukeStanke, and @RodyZakovich. (Tag @VizWizBI too – he would REALLY love to see your work!)
Track your progress
Also, don’t forget to track your progress using this Workout Wednesday form.
#SPOILERS
- You need to create a parameter and 5 calculated fields.
- 3 of the calculated fields are just duplicating the sub-category field.
- One of the calculated fields is equal to the parameter values.
- Make one sheet first before you do the rest. This way you can just duplicate them.
- You can use FIXED or INCLUDE level of detail functions to solve this problem. Or you can use a table calculation.
- ROUND({FIXED [Order ID], [Sub-Category] : SUM([Profit])}/[Round Parameter]) * [Round Parameter]
- You can always download the workbook for more help.