Easy

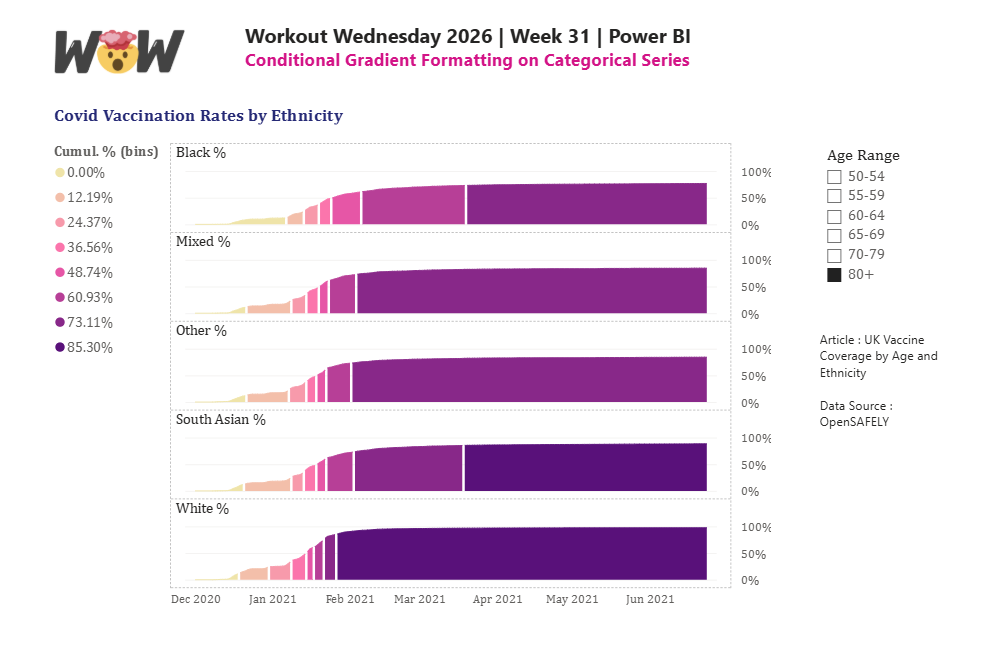
2026 Week 31 | Power BI: Conditional Formatting Categorical Gradients

Introduction This week, we are utilising new features from the July 2026 Power BI update. With this update, conditional formatting can be now be applied on graphs with a categorical legend. This weeks challenge will look to create a cumulative line graph of vaccination rates across population groups (either age or ethnicity), banded by % […]

2026 Week 31 | Power BI: Conditional Formatting Categorical Gradients Read More »

Power BI, Workout Wednesday
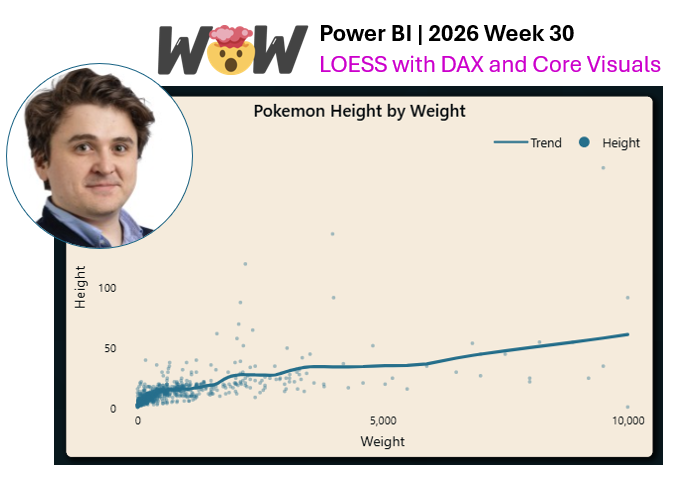
2026 Week 30 | Power BI: LOESS with DAX and Core Visuals

Introduction This week, we have another new contributor to Workout Wednesday for Power BI: Cameron Ayre. Give Cameron’s challenge a try! This week, we’re creating smoothed lines with a handy LOESS measure.    We’ll use it to turn noisy data like this: Into this:   Kerry Kolosko challenged us to do this last year , with Deneb

2026 Week 30 | Power BI: LOESS with DAX and Core Visuals Read More »

Power BI, Workout Wednesday
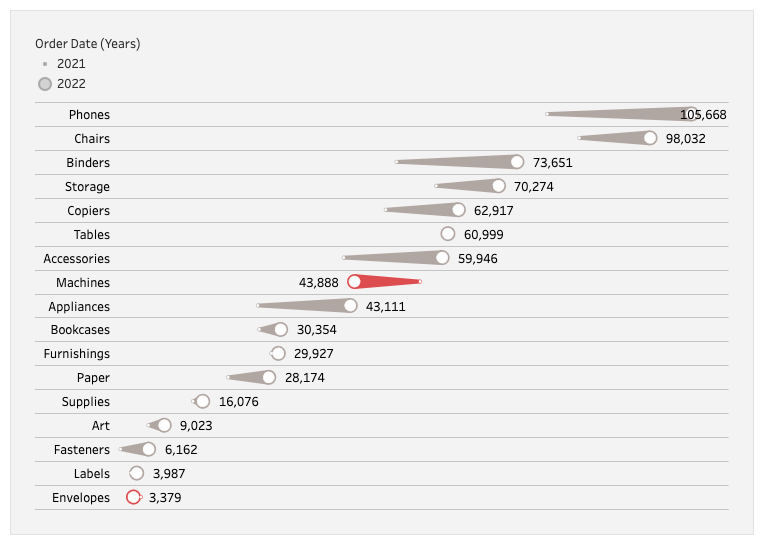
2023 Week 8: Can you build a comet chart as an alternative to a side-by-side bar chart?

Introduction The theme for February 2023 has been alternatives. This week I present an alternative (and trust me, there are many other alternatives) to my least favorite chart: the side-by-side bar chart. The reason this chart is so difficult for me is because it takes up a lot of space and when I am doing

2023 Week 8: Can you build a comet chart as an alternative to a side-by-side bar chart? Read More »

Tableau, Workout Wednesday