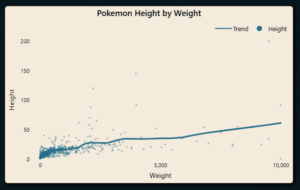
1. Load a table with two paired values (e.g. Height and Weight, Age and Salary, Apples Eaten and Doctor Visits, etc.)
2. Take this measure:
LOESS/LOWESS = // Based on https://github.com/vega/vega/blob/main/packages/vega-statistics/src/regression/loess.js
VAR Bandwidth = 0.3
VAR AllPoints = ALLSELECTED ( 'Table' )
VAR NumberOfRows = COUNTROWS ( AllPoints )
VAR NeighbourCount = MAX ( 2, ROUNDDOWN ( Bandwidth * NumberOfRows, 0 ) )
VAR SelectedXValue = SELECTEDVALUE ( 'Table'[X] )
VAR Distances =
ADDCOLUMNS (
AllPoints,
"Distance", ABS ( [X] - SelectedXValue )
)
VAR Neighbours = TOPN ( NeighbourCount, Distances, [Distance], ASC)
VAR EdgeDistance = MAXX ( Neighbours, [Distance] )
VAR TriCubeWeights =
ADDCOLUMNS (
Neighbours,
"Weight", POWER ( 1 - POWER ( DIVIDE ( [Distance], EdgeDistance, 1 ), 3 ), 3 )
)
/// Can't use LINESTX() as we need the weightings :(
VAR TotalWeight = SUMX ( TriCubeWeights, [Weight] )
VAR WeightedXMean = SUMX ( TriCubeWeights, [Weight] * 'Table'[X] ) / TotalWeight
VAR WeightedYMean = SUMX ( TriCubeWeights, [Weight] * 'Table'[Y] ) / TotalWeight
VAR WeightedXYMean = SUMX ( TriCubeWeights, [Weight] * 'Table'[X] * 'Table'[Y] ) / TotalWeight
VAR WeightedXXMean = SUMX ( TriCubeWeights, [Weight] * 'Table'[X] * 'Table'[X] ) / TotalWeight
VAR Slope = DIVIDE ( WeightedXYMean - WeightedXMean * WeightedYMean, WeightedXXMean - WeightedXMean * WeightedXMean )
VAR Intercept = WeightedYMean - Slope * WeightedXMean
VAR EstimatedY = Slope * SelectedXValue + Intercept
RETURN EstimatedY
3. Swap out ‘Table’ for your table name, and replace [X] and [Y] with your two columns.
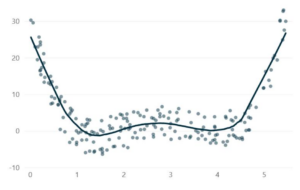
4. Pop it into a line chart, with your [X] column on the x axis
5. Add your [Y] as an additional y axis value, then switch on markers and switch off the line