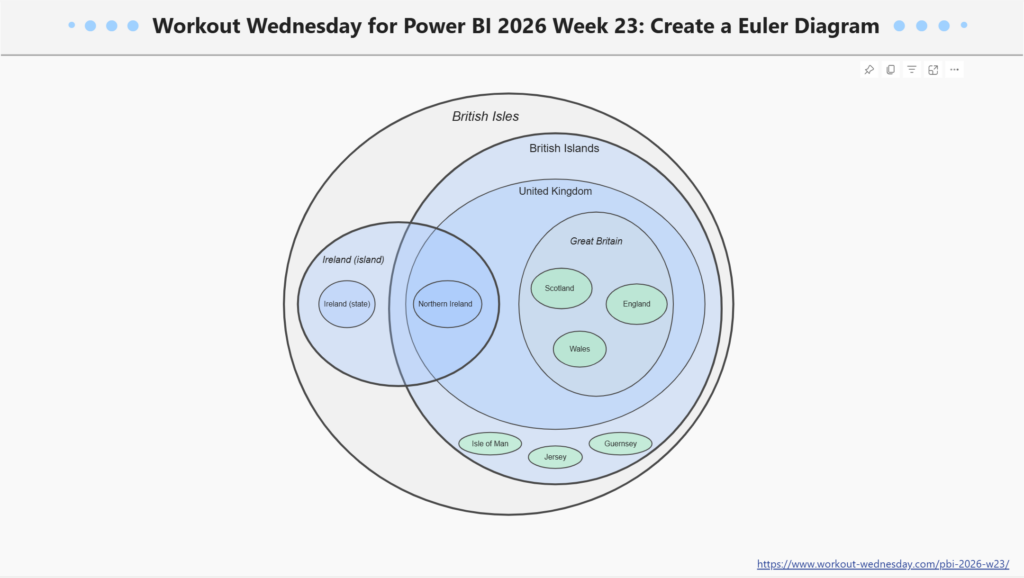
Deneb

2024 Week 2 | Power BI: Soda Pop Sales in a Jittered Column Chart

Introduction This week we have our first guest post of 2024! Today’s challenge comes from Imran Haq (LinkedIn, X). I have always admired his Deneb skills, so I’m excited to share this report with you today. We are making a jittered column chart with Deneb. The theme of soda (or pop, coke, or whatever you …

2024 Week 2 | Power BI: Soda Pop Sales in a Jittered Column Chart Read More

2023 Week 45 | Power BI: Create a dumbbell chart with Deneb

Introduction Welcome back to Workout Wednesday! This week we’re creating a dumbbell chart to compare 2 sets of values using Deneb! If this is your first time using Deneb I highly recommend you play around with either the Vega or Vega-lite languages in the online editor, where you can load the code from examples, amend it, …

2023 Week 45 | Power BI: Create a dumbbell chart with Deneb Read More

2023 Week 38 | Power BI: Visualize the State of Quantum Computing with Deneb

Introduction The race to dominate quantum computing has the potential to revolutionise various fields by solving complex problems that are currently intractable for classical computers.  This week we will recreate the infographic “The State of Quantum Computing” published in the Harvard Business Review magazine (Harvard Business Review, vol. 101, issue 2, 2023, p. 25). Requirements …

2023 Week 38 | Power BI: Visualize the State of Quantum Computing with Deneb Read More

2023 Week 24 | Power BI: Visualize Change Between Two Points in Time with Deneb

Introduction This week we are continuing our viz efforts inspired by the 1 dataset 100 visualizations project, presented by the Data Viz Project. Last week, Shannon challenged us to create as many visuals as possible using the core visuals available in Power BI. This week’s challenge is to create visuals using the Deneb custom visual. I have …

2023 Week 24 | Power BI: Visualize Change Between Two Points in Time with Deneb Read More

2023 Week 07 | Power BI: Non-linear Regression

Introduction This week for Workout Wednesday we will be trying our hand at non-linear regression with the Deneb custom visual. With Vega and Vega-Lite we can create a non-linear line of best fit over our data points and utilise the statistical API to return a correlation coefficient. Requirements Power Query Obtain the dataset from the …

2023 Week 07 | Power BI: Non-linear Regression Read More

2022 Week 46 | Power BI: My Second Deneb

Introduction During week 42’s community month challenge brought to us by Thys van der Westhuizen – Thys built on my week 37 challenge – My First Deneb. For that week’s challenge I built out three basic bar charts using Deneb visuals, and subsequently, Thys continued to build a few more amazing visuals in his challenge. …

2022 Week 46 | Power BI: My Second Deneb Read More

2022 Week 37 | Power BI: My First Deneb

Introduction I sit back every week and watch the other amazing members of the #WorkoutWednesday Power BI team go through Deneb challenges like it’s nothing. The visuals are fantastic, the customizations are intriguing, but the truth is – I’ve never done a Deneb visual! Until this week that is.    If you’re like me and …

2022 Week 37 | Power BI: My First Deneb Read More

2022 Week 35 | Power BI: Make a Comet Chart

Introduction This week we are exploring another lesser used chart type: the comet chart. Comet charts show the evolution of one or two measures over time. They allow you to see change between two time periods across a category while emphasizing the direction of the change. You might use a comet chart instead of a dumbbell …

2022 Week 35 | Power BI: Make a Comet Chart Read More

Scroll to Top